.png) ☰☰
☰☰.png)
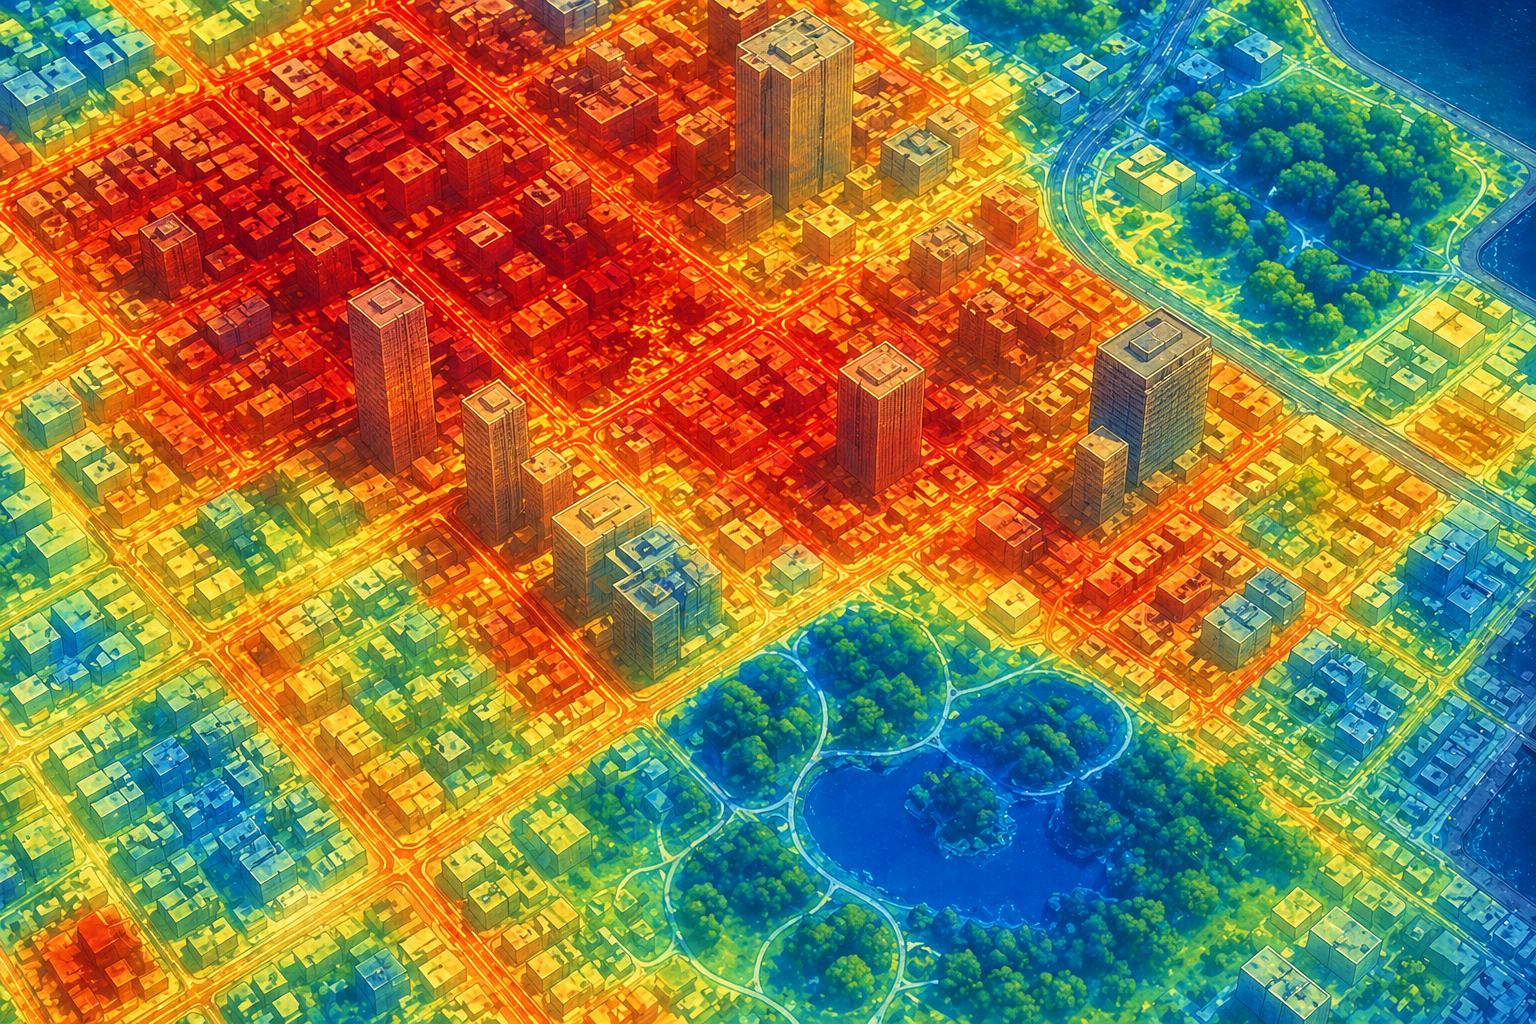
A single temperature for an entire city is easy to publish — and almost useless to operate from.
On the BEFORE map, the area is largely flattened into a narrow temperature view, making critical local variation difficult to see.
On the AFTER map, FortyGuard’s forecasting model reveals a broader and more precise temperature range across streets, neighborhoods, and natural features.
In some areas, the difference between cooler zones around 70°F and hotter pockets near 110°F can reach up to 40°F.
That level of detail reveals microclimates you can act on — helping identify heat hotspots, prioritize interventions, and make sharper, data-driven decisions.
Heat does not move evenly through a city. It pools along certain corridors, rises from different surfaces at different rates, and peaks at different hours across the same urban grid.
Most forecasting still flattens that variation into a single citywide number. Block to block, hour to hour, the real picture disappears.
That level of generality is enough for awareness.
It is not enough for operations.
Today, FortyGuard is releasing 12-hour temperature forecasting inside the Temperature Dashboard® — hourly forecasts, delivered at local resolution across every supported region.
Long-range global forecasts optimize for coverage and horizon. FortyGuard optimizes for the next operating window — local 2m-above-ground air temperature, because people, assets, and operating thresholds respond to near-surface air conditions, not to land surface temperature or coarse averages.
Forecasts are delivered hour by hour, not as averaged windows or daily summaries. Users can track how temperature is expected to move through the coming hours and plan around exact points in time.
Every forecast is produced at geohash6 granularity — approximately street-level detail.
The same location-specific precision that defines the Temperature Dashboard® now extends into the next 12 hours.
A half-day forward view is designed to match the rhythm of operational planning:
The forecast layer is generated using a rich environmental signal — not temperature alone, but surrounding atmospheric, surface, and terrain conditions — giving the output awareness of the factors that actually shape local heat behavior.
The forecast is delivered inside the same Temperature Dashboard® interface users already work in.
No new tools, no separate workflows — forecasting simply extends what the platform already does.
Temperature intelligence means understanding the temperature a specific place is likely to experience at a specific time — in a form that can drive action.
That is the shift: from generalized weather reporting to decision-grade temperature intelligence.
Under the hood, FortyGuard's machine learning system models how local temperature evolves across space and time, conditioned on atmospheric, surface, and terrain context.
The result is a forward-looking view of:
— at the resolution where decisions are actually made.
The 12-hour horizon is deliberate.
It aligns with the windows where action still matters:
Longer-range models remain useful for broad planning.
Near-term local intelligence is what changes execution.
A coarse average can tell you that a city is hot.
It cannot tell you:
When local temperature gradients are preserved, so is the decision they inform.
That difference is operationally meaningful.
Stronger temperature signals improve:
Because the temperature variable is closer to what the operation actually experienced.
A daily high is a summary.
A local hourly forecast is a tool.
Visit the Temperature Dashboard® to access 12-hour forecasting and experience how local temperature intelligence supports real-world operations.
👉 Explore the Temperature Dashboard®
👉 Book a Demo to See 12-Hour Forecasting in Action
FortyGuard is building the temperature intelligence layer for the way the world actually operates.
.png)
.png)


.png)
.png)

.png)