.png) ☰☰
☰☰From 14 to 20 August 2025, Miami stayed warm through every single night —and the air temperature map shows exactly where the heat refused to leave.
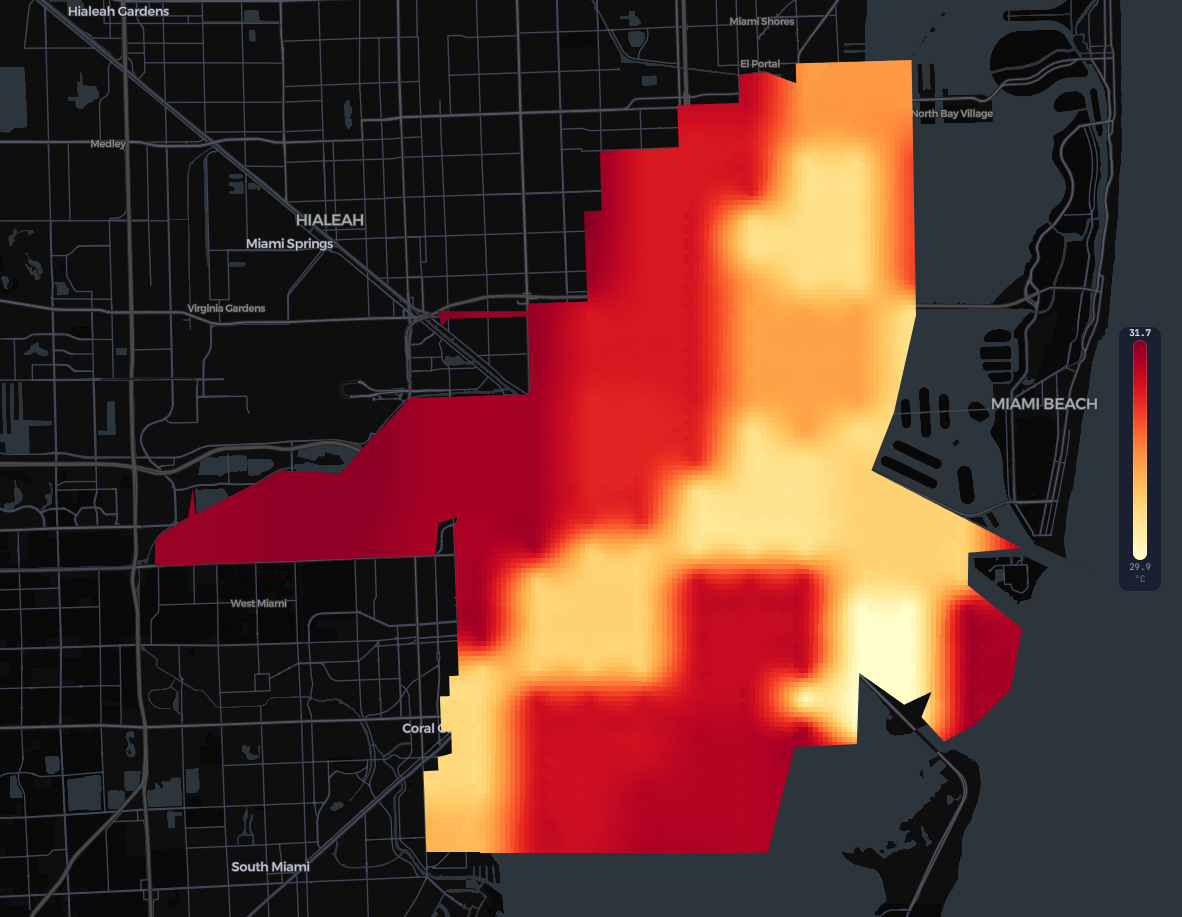
Across the seven-day window, the average daily temperature across Miami landed at 89.1 °F (31.7 °C) — and 77 % of the city sat above that daily average for the entire week. The threshold here is the data's own daily mean (89.1 °F / 31.7 °C), so 77 % persistence means more than three out of every four square-kilometres of Miami stayed above its own seven-day average across all seven days. This was not a week of localised hot spots. It was a week where the whole city was hot, uniformly, and stayed that way.
Zooming in on where the heat retained most stubbornly, the northwestern part of the city reached 94 % persistence above that same daily average — the densest spatial signal in the dataset. Built-up inland blocks with limited sea-breeze reach show up as the clearest hotspot in the city.
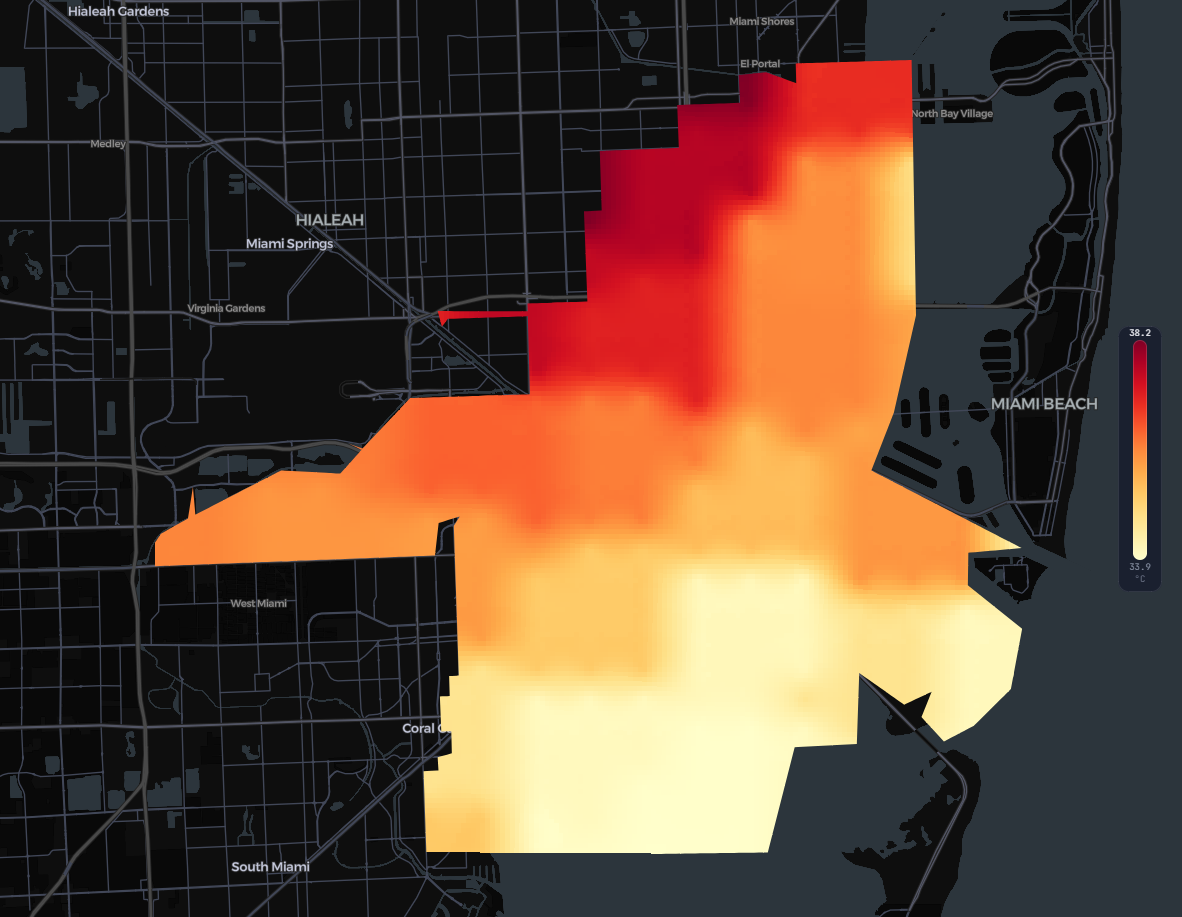
The spatial pattern is the story here. Heat concentrated in the northwest across every view we took of the data — the weekly mean, the per-cell maximum, and the recurring 13:00 peak-hour snapshot all agree. To make the spatial story clear, we put the temperature and solar-radiation surfaces side by side. Temperature is the subject; solar radiation is one of several variables we correlate against.
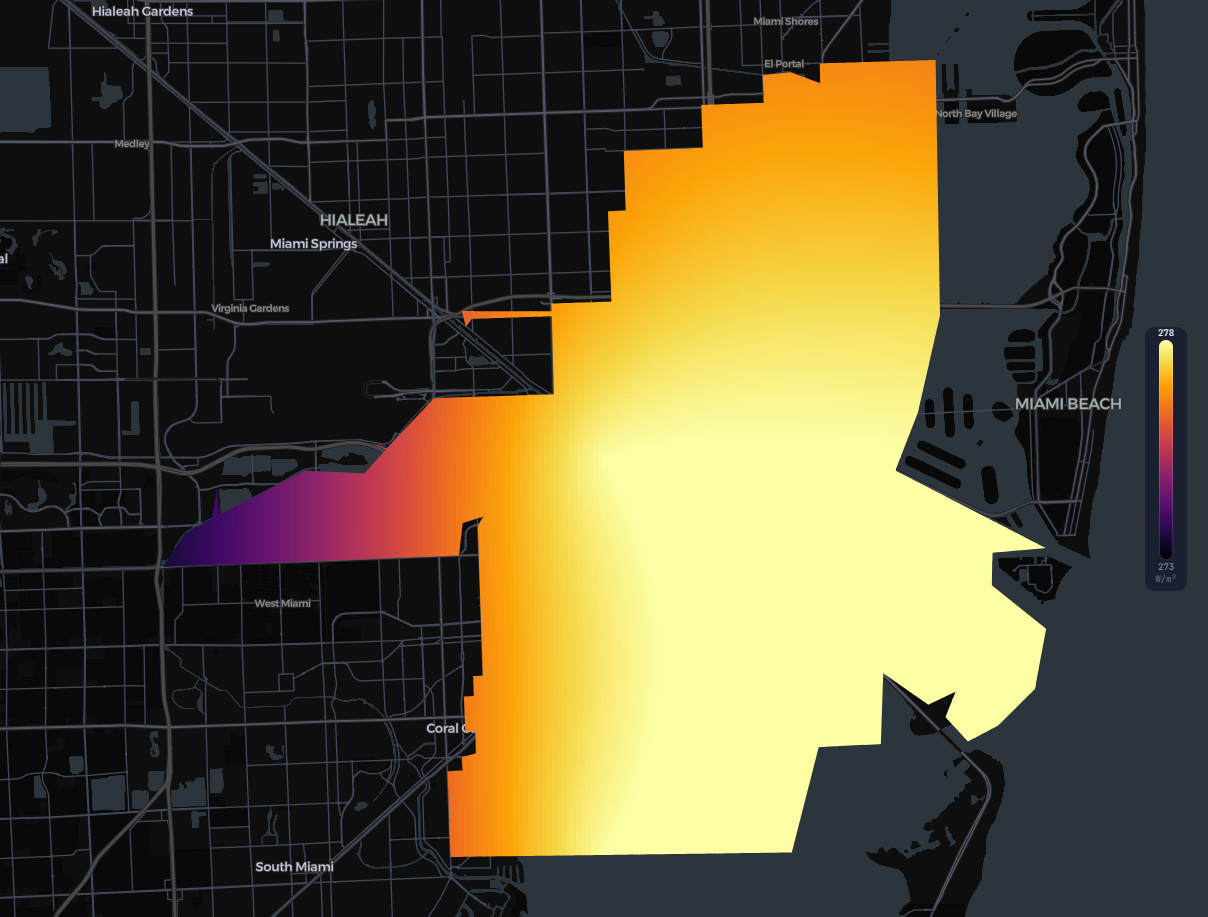
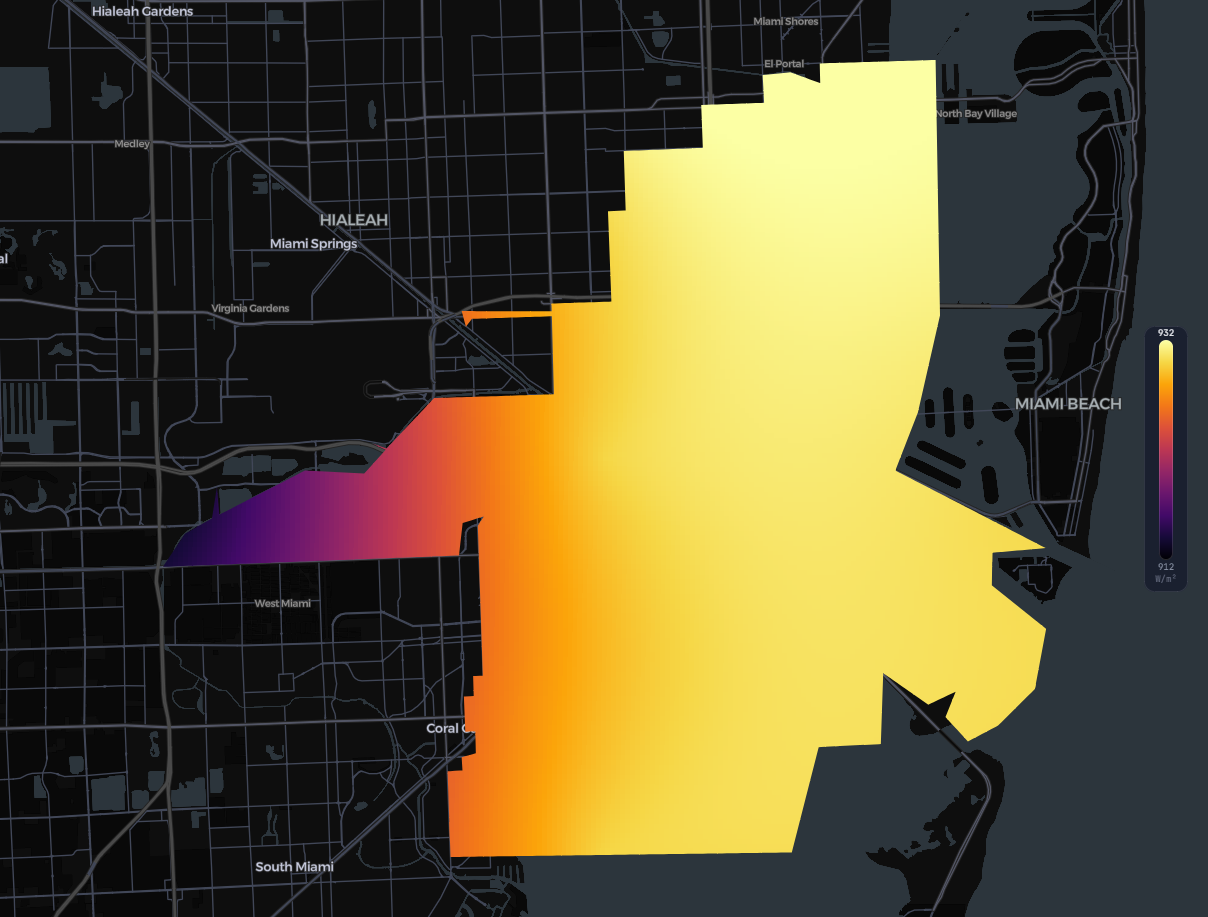
Temperature pins to the northwest in both the mean and the maximum view. Solar radiation doesn't track it spatially — the mean is actually lower across the mid western lobe and higher along the bayside, and the maximum reaches into a different central-to-southeast band. The two layers correlate as components of the heat story, but they don't co-locate.
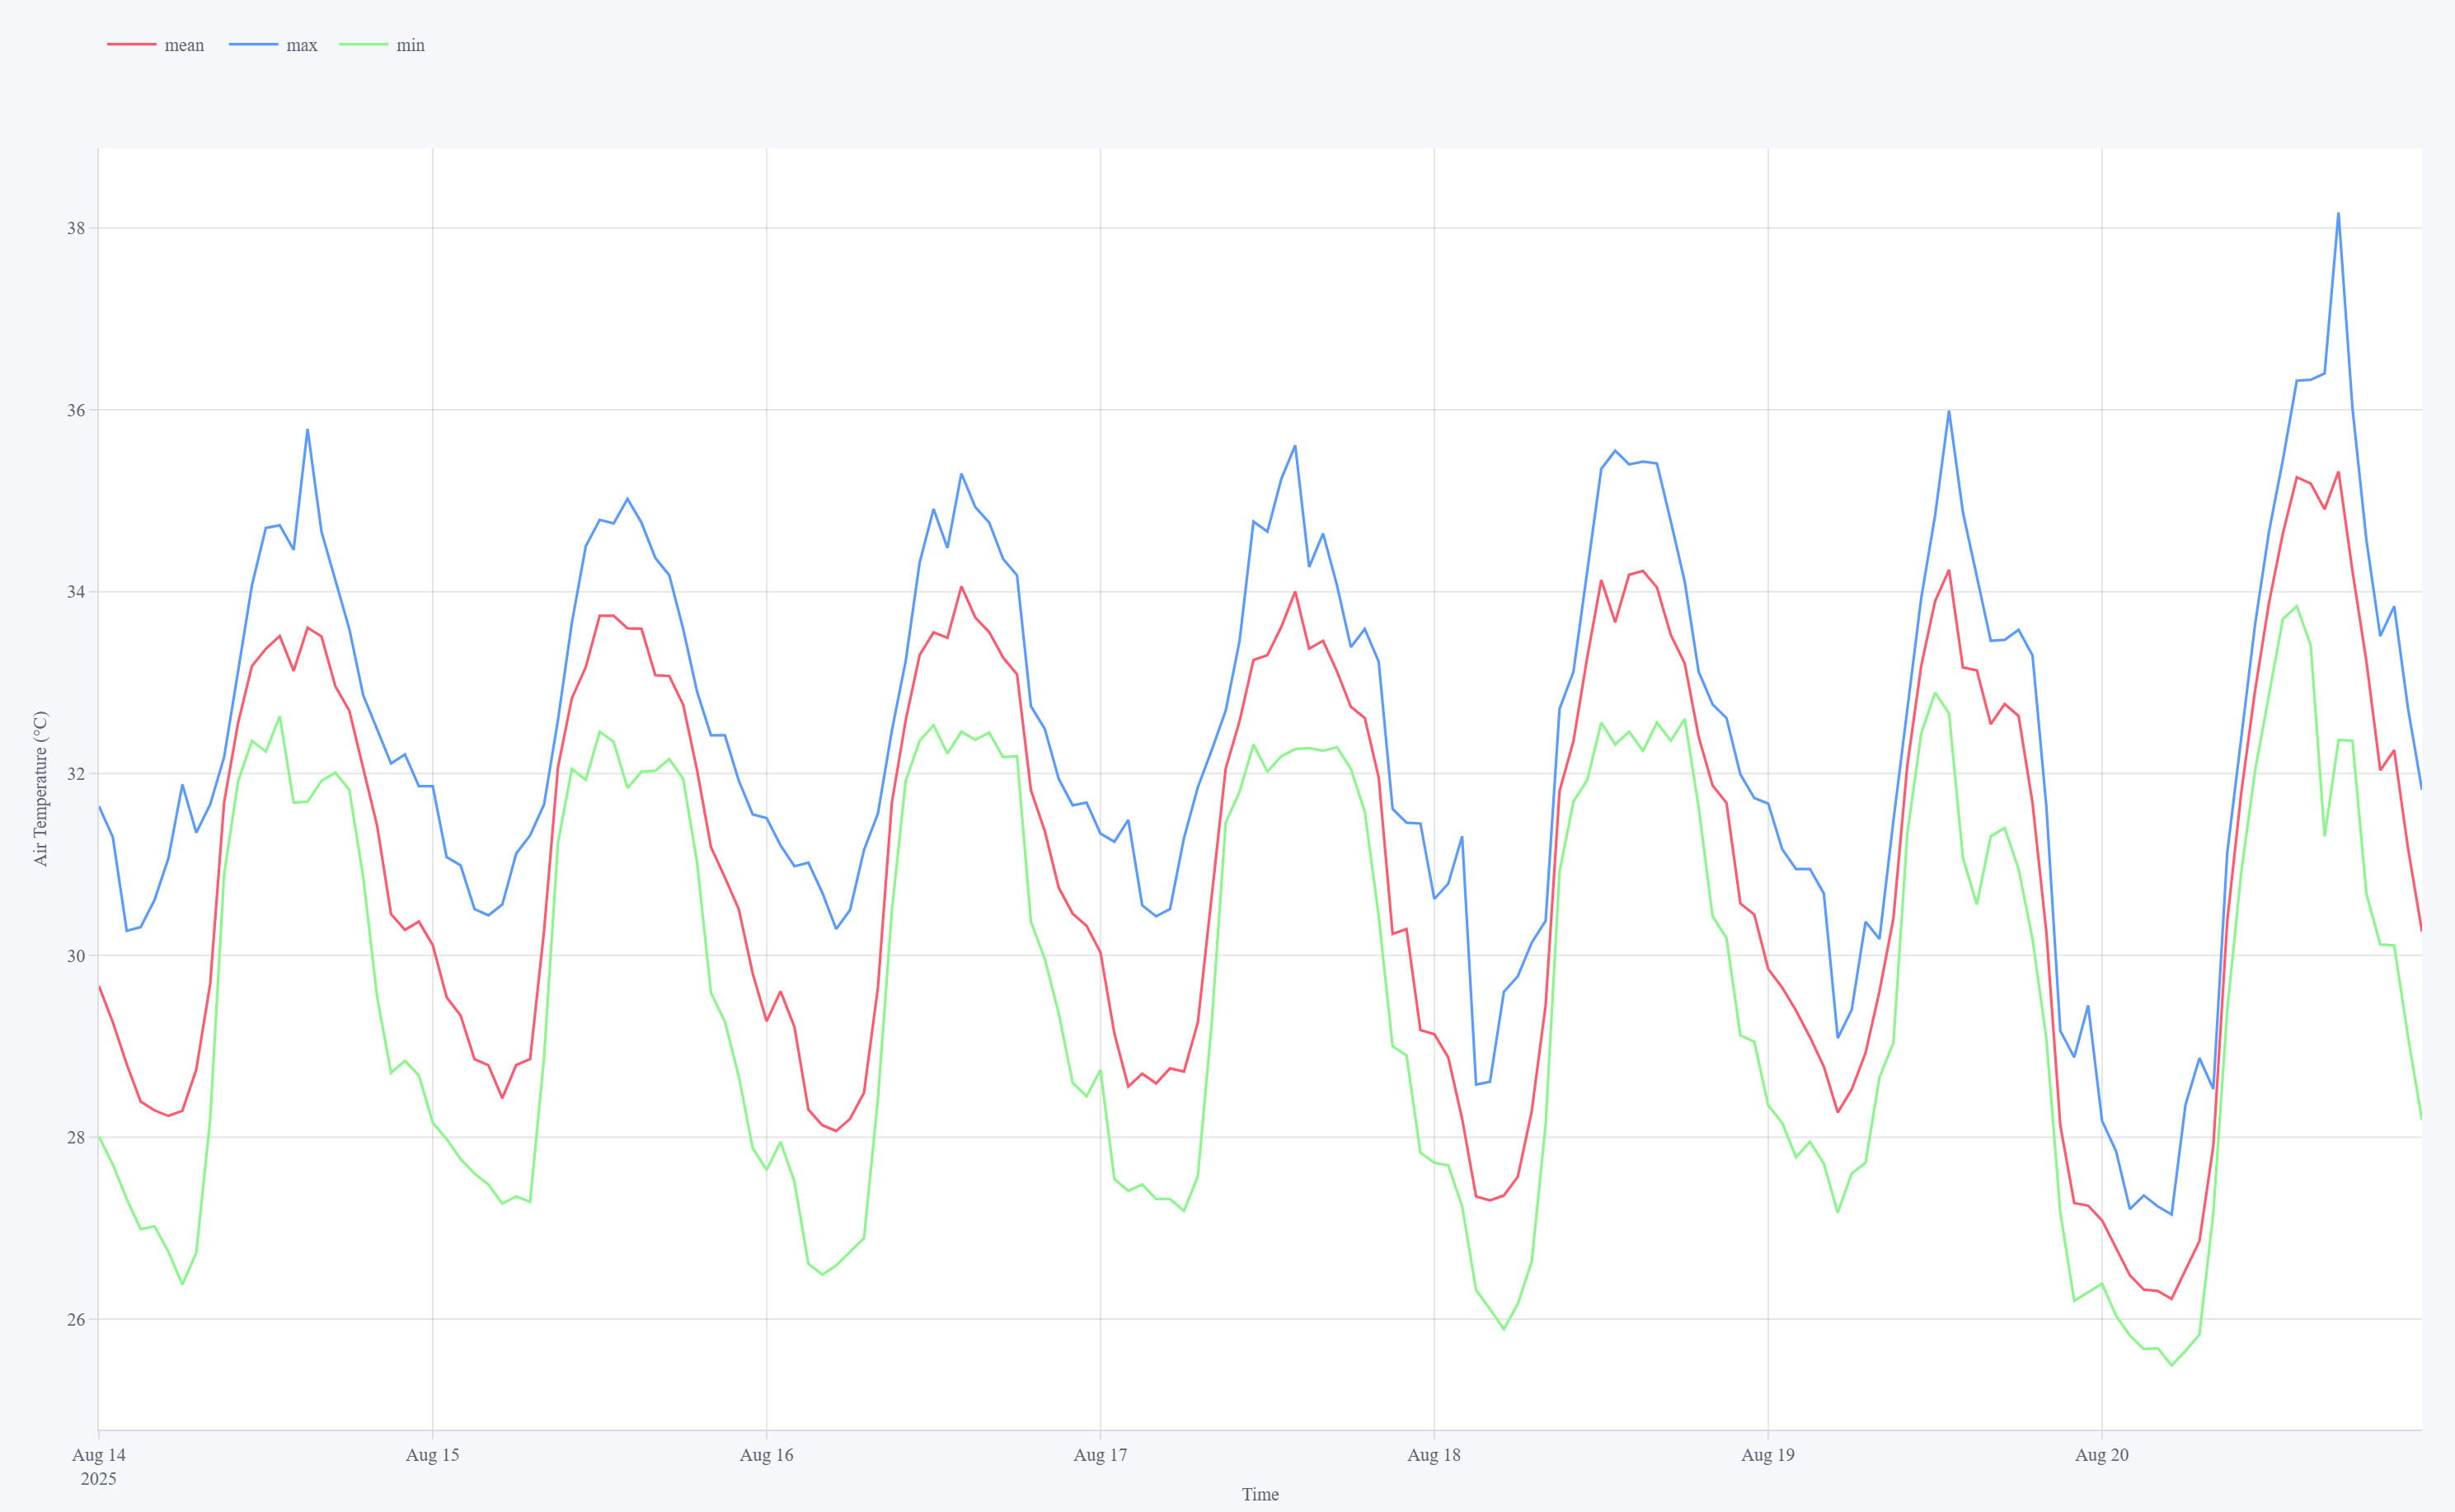
The hourly time series tells the second half of the spatial story. Across the seven days, the hourly air temperature ranged from 77.9 °F (25.5 °C) to 100.7 °F (38.1 °C) — peaking at 1:00 PM on 20 August. The diurnal envelope repeats almost identically each day, and the floor — the minimum value across the coolest hour of the coolest night — never dropped below ~78.8 °F (~26 °C). There was no recovery night. No gap.
When the floor stays elevated, exposure compounds. People without air conditioning don't get a break. Cooling demand on the grid sits near peak across more hours of the day. Outdoor workers cross unsafe thresholds earlier in the afternoon. Each of those is a downstream consequence of one upstream fact: the heat never fully left, and it concentrated where Miami's urban fabric is densest.
The spatial concentration also points to where intervention has the highest return. The northwestern part of the city is doing most of the work to push the city-wide average above its own daily mean. Targeted tree canopy, cool-roof retrofits, or shaded pedestrian corridors there would deliver more relief per dollar than spreading the same effort uniformly across the city.
Area: Miami City — 143 km²
Window: 14 → 20 August 2025
Average daily temperature (mean): 89.1 °F (31.7 °C)
Peak hourly: 100.7 °F (38.1 °C) on 20 August at 1:00 PM
Share of city persisting above the daily average all week: 77 %
Northwest persistence: 94 %
Peak date and time: August 20, 1:00 PM local time
Diurnal range: 22.7 °F (12.6 °C)
Lowest hourly reading: 77.9 °F (25.5 °C) In cities, heat is not evenly distributed —and neither is risk.
Want this analysis for your city? Reach out to the FortyGuard team for location-specific heat intelligence at info@fortyguard.com.
.png)
.png)


.png)
.png)

.png)