.png) ☰☰
☰☰Greater Tripoli's heat problem is not one problem. It is two — in different geographies, driven by different physical processes, and requiring different intervention strategies. The finding emerged from a full-year, city-wide thermal assessment combining hourly climate reanalysis with 30-metre satellite thermal imagery, and it reframes what a masterplan team should actually do about heat in this city.
The assessment covered 1,627 km² of Greater Tripoli, produced ~14.2 million hourly perceived-temperature readings across a 5 km climate grid, and layered 98 cloud-free Landsat 8/9 thermal scenes over the city plus 33 additional scenes for a deep-dive of the highest-priority zone. This post is the case study — what was studied, what the data showed, and what it enables.
The assessment was designed to inform masterplan-scale intervention decisions. It answers two operational questions: when is Tripoli dangerously hot (across the year, across seasons, across the daily cycle), and where does the heat concentrate spatially (at both the district scale and the block scale). The study boundary is the greater metropolitan area including the coastal urban core, the inland districts, and the surrounding agricultural belts.
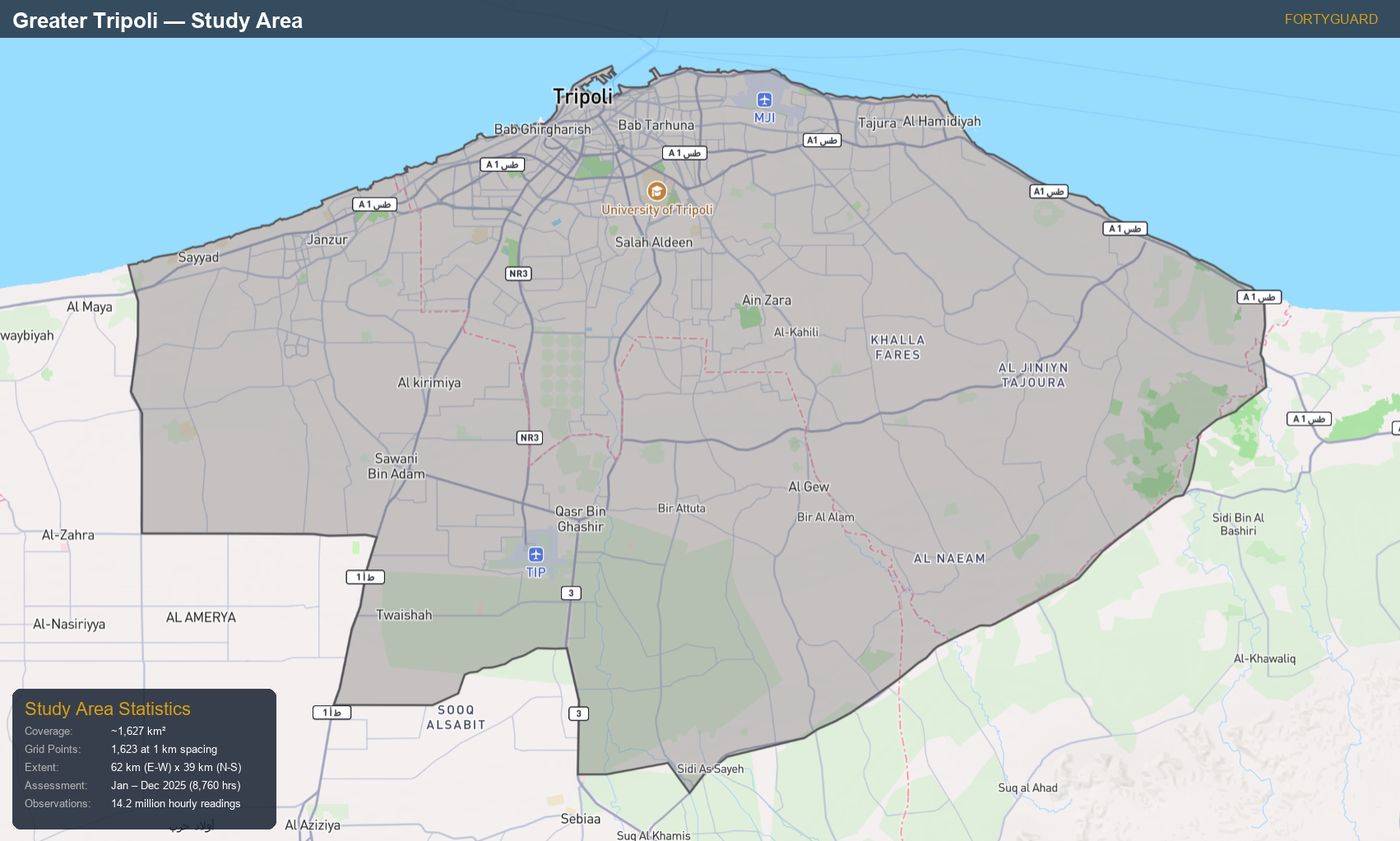
The temporal scope is full calendar year 2025 at hourly resolution for the climate baseline, and peak summer (June–August) for the 30 m satellite composite. The city-scale climate grid uses 1,623 grid points at ~5 km spacing, with satellite thermal imagery resolving spatial detail down to 30 m. A dedicated deep-dive of the highest-priority human-exposure zone — Al-Hadba and its neighbouring districts — was conducted over a narrower 78 km² area of interest using 33 additional cloud-free Landsat scenes.
In total, the assessment integrates ~14.2 million hourly climate observations with 131 satellite thermal scenes (98 citywide + 33 Al-Hadba zoom) and layered spectral and land-cover analytics.
Every finding in the assessment traces back to five explicit data sources, layered together to answer questions no single source can answer alone.
ECMWF ERA5 provides the hourly climate baseline. Air temperature, relative humidity, wind speed, and radiation components are extracted at 2 m and 10 m heights and combined into the Universal Thermal Climate Index (UTCI) — a physiologically calibrated "perceived temperature" that captures what a human body actually experiences. ERA5 covers the study area at 5 km grid spacing (interpolated from ~30 km native cells), hourly, for a full year — producing the 14.2 million hourly readings across 1,623 grid points that underpin the exposure statistics in this post.
Where ERA5 characterises what humans feel, Landsat 8/9 Collection 2 Level-2 imagery (obtained from the Microsoft Planetary Computer) characterises what surfaces do. Land Surface Temperature (LST) is measured directly at 30 m resolution during morning overpasses (approximately 10:30 am local), with each scene revisiting every ~8 days. 98 cloud-free scenes were retained over the full year 2025, with the peak-summer (June–August) subset used for the citywide composite; a separate narrower-AOI scene search returned 33 additional cloud-free June–August scenes for the Al-Hadba deep-dive zoom. Combining Landsat 8 and Landsat 9 typically yields 30–50 usable scenes per year over Tripoli, depending on cloud cover.
Five spectral indices were computed per pixel per scene from the same Landsat imagery: NDVI (vegetation), NDBI (built-up), NDMI (moisture), BSI (bare soil), and albedo (reflectance). These indices explain the why behind each hot patch — dry vegetation, exposed soil, low reflectance, absence of moisture — enabling intervention targeting rather than just identification.
ESA WorldCover 2021 (10 m native, resampled to 30 m for cross-tabulation with Landsat LST) provides land-cover classification into 11 classes — tree cover, shrubland, grassland, cropland, built-up, bare/sparse vegetation, water, and others. This is what makes the counterintuitive surface-composition finding possible: the hottest pixels in the city can be identified not just by location but by what surface class they sit on.
OpenStreetMap (OSM) point-of-interest data was overlaid on the Al-Hadba deep-dive zone to produce an illustrative screening of sensitive assets — schools, mosques, clinics, food markets, industrial workplaces, hospitality venues. This is a pilot screening intended to demonstrate the method; a validated municipal facility register would be required for operational deployment.
In combination: climate reanalysis for physiological exposure, satellite thermal for spatial detail, spectral indices for causal attribution, land classification for surface composition, and OSM for pilot asset screening. Every finding below is grounded in one or more of these sources.
The intellectual move at the heart of the assessment is recognising that "where is the heat" is actually two questions, not one — and they have different answers.
Where do humans experience the most sustained heat stress? That is physiological. Governed by air temperature, humidity, wind, and radiation. Measured through UTCI. Best captured through ERA5 hourly reanalysis at full-year resolution.
Where do surfaces themselves accumulate the most heat? That is spatial. Governed by surface material, moisture, vegetation, and albedo. Measured through Landsat LST. Best captured through 30 m thermal imagery in peak summer.
These are not competing metrics. They answer different operational questions, and treating them as a single metric produces the wrong intervention strategy. A district with low wind and dense human exposure can produce dangerously high UTCI even when its surfaces are not the hottest in absolute terms. Vast tracts of dry, exposed agricultural grassland can produce the highest LST values even though no one is standing on them. Both are real. Both need intervention. But the interventions differ.
Before locating heat spatially, the assessment characterised its magnitude and rhythm across the year. Three findings frame the operational reality.
Tripoli experiences ~1,800 dangerous heat-stress hours per year (UTCI > 32°C) — equivalent to roughly 75 calendar days or 225 eight-hour working days of conditions where outdoor exposure is unsafe. Roughly 1,035 of those hours cross into very strong heat stress (UTCI > 38°C), and ~240 hours per year cross into extreme heat stress (UTCI > 46°C). Peak perceived temperature reaches 62.2°C (July, in the southern agricultural belt).
The dangerous season runs March through October — eight months. March already carries 13.5% strong-or-worse heat-stress hours. October still carries 20.8%. July peaks at 41.2%. Heat measures cannot be activated at the start of June and deactivated at the end of September; that is a common operational error.
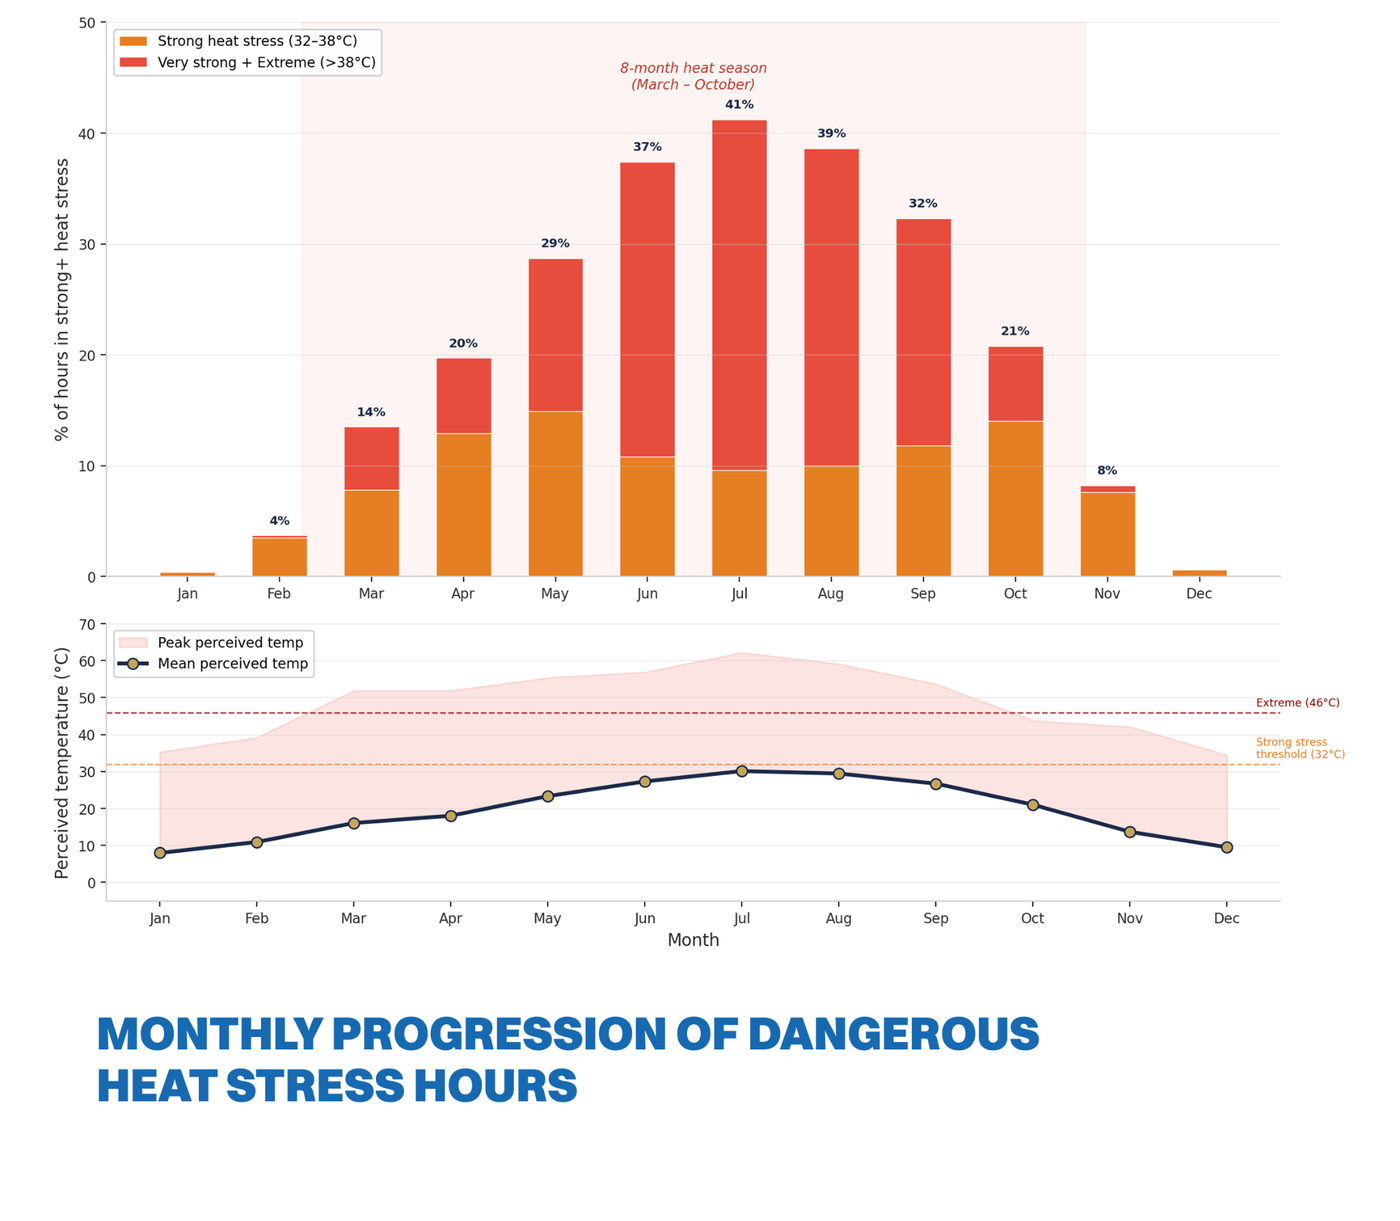
A compounding factor: wind speed drops during the hottest months, from a March average of 3.95 m/s to an August average of 2.76 m/s. Natural cooling is least available precisely when it is most needed. Engineered cooling has to fill that gap.
Within each day during peak season, heat concentrates in a 4–6 hour midday window (11 am to 5 pm). During this window from May through September, mean UTCI reaches 45°C across the entire city — meaning spatial variation effectively disappears at midday. The question shifts from "where is it safe?" to "when is it safe?" Outdoor activity scheduling — not zone-based intervention — is the only effective tool during this window.
A correlation analysis of the four UTCI inputs against the citywide spatial pattern identified the dominant driver. Wind speed correlates with mean UTCI at r = −0.913 — explaining 83.3% of the spatial variance. Temperature and radiation contribute to absolute thermal load but do not differentiate locations at this scale; they are spatially uniform across the city. Wind sheltering — the absence of airflow — is the only factor that creates materially different thermal conditions from one part of the city to another.
That points directly to a specific zone. The Al-Hadba inland zone — a four-district composite covering Al-Hadba, Suq Al-Khamis, Khallet Al-Furjan, and Al-Swani, encompassing 158 ERA5 grid points — has the lowest mean wind speed in the city (zone-wide 2.44 m/s, dropping to 2.25 m/s in the most sheltered subdistrict, against a citywide mean of 3.12 m/s). It is the most thermally stressed zone in Tripoli.
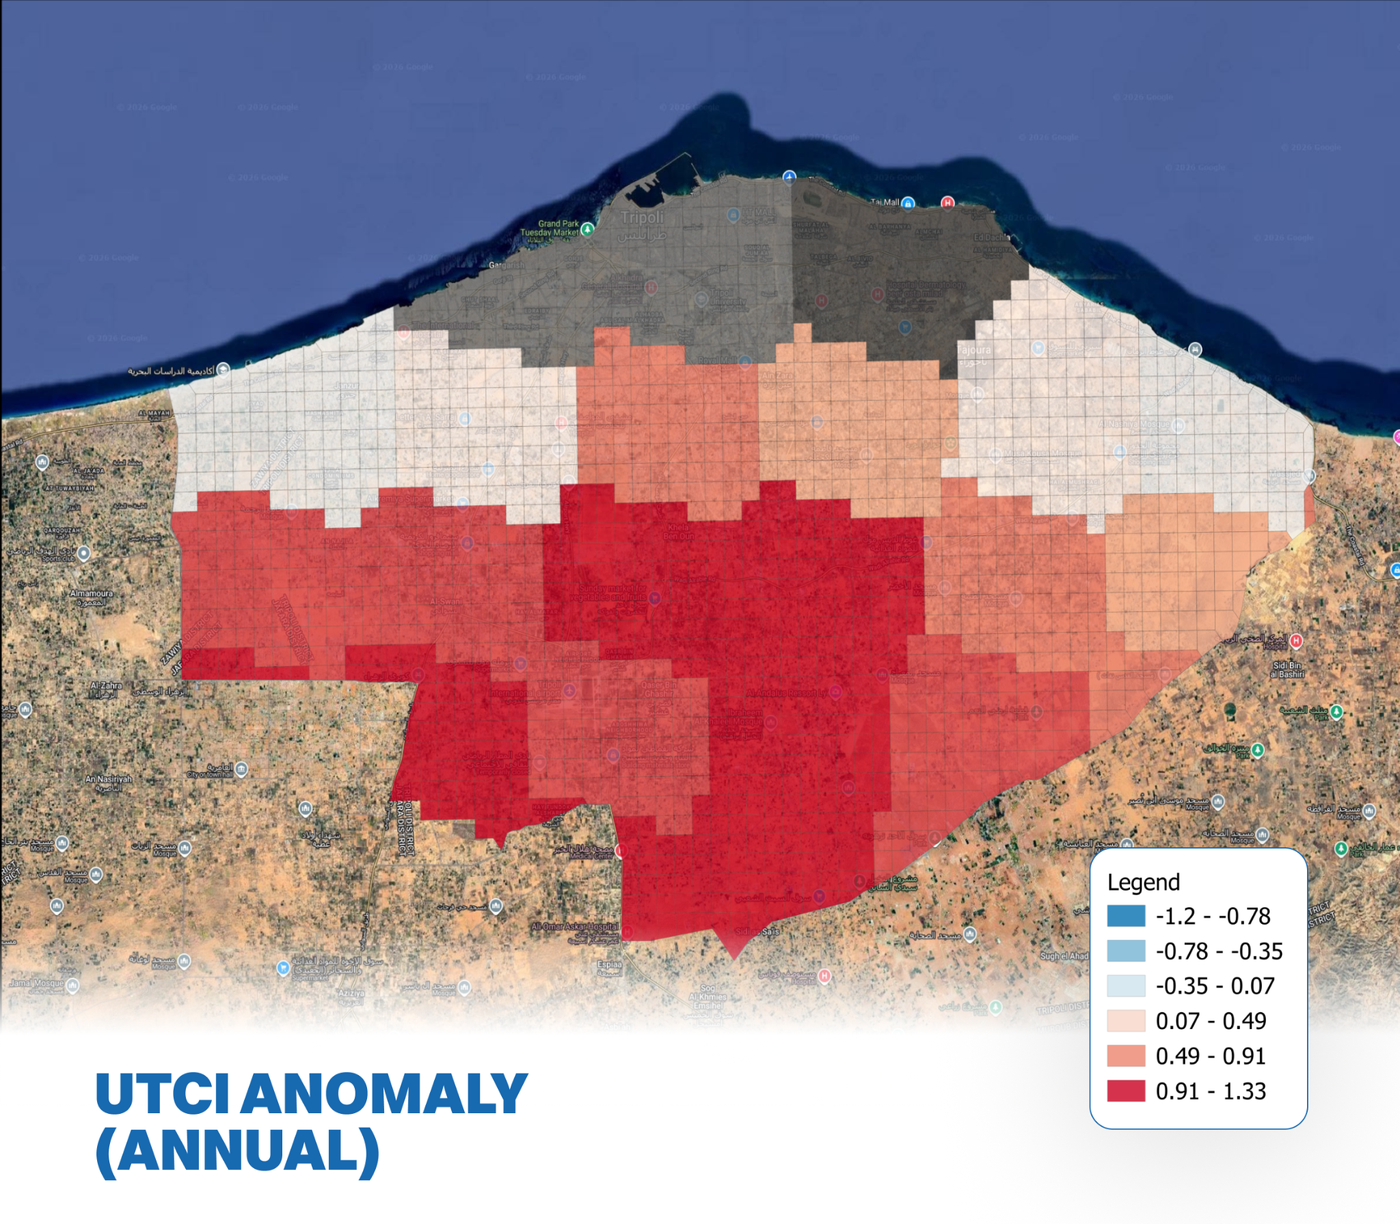
~1,935 dangerous hours per year across the zone (~22.1% of annual hours), rising to ~1,962 hours (22.4%) in the worst-exposed subdistrict. P95 perceived temperature 44.1°C, P99 ~50.9°C, zone peak ~59.8°C (the citywide 62.2°C peak occurs in Bin Ghashir, not here). During peak months July and August, over 42% of hours reach strong or extreme stress levels.
One saving grace: the diurnal swing is 11–12°C, providing good nighttime recovery. Residential buildings do not face a nocturnal-persistence problem here. The intervention focus is daytime public-realm exposure.
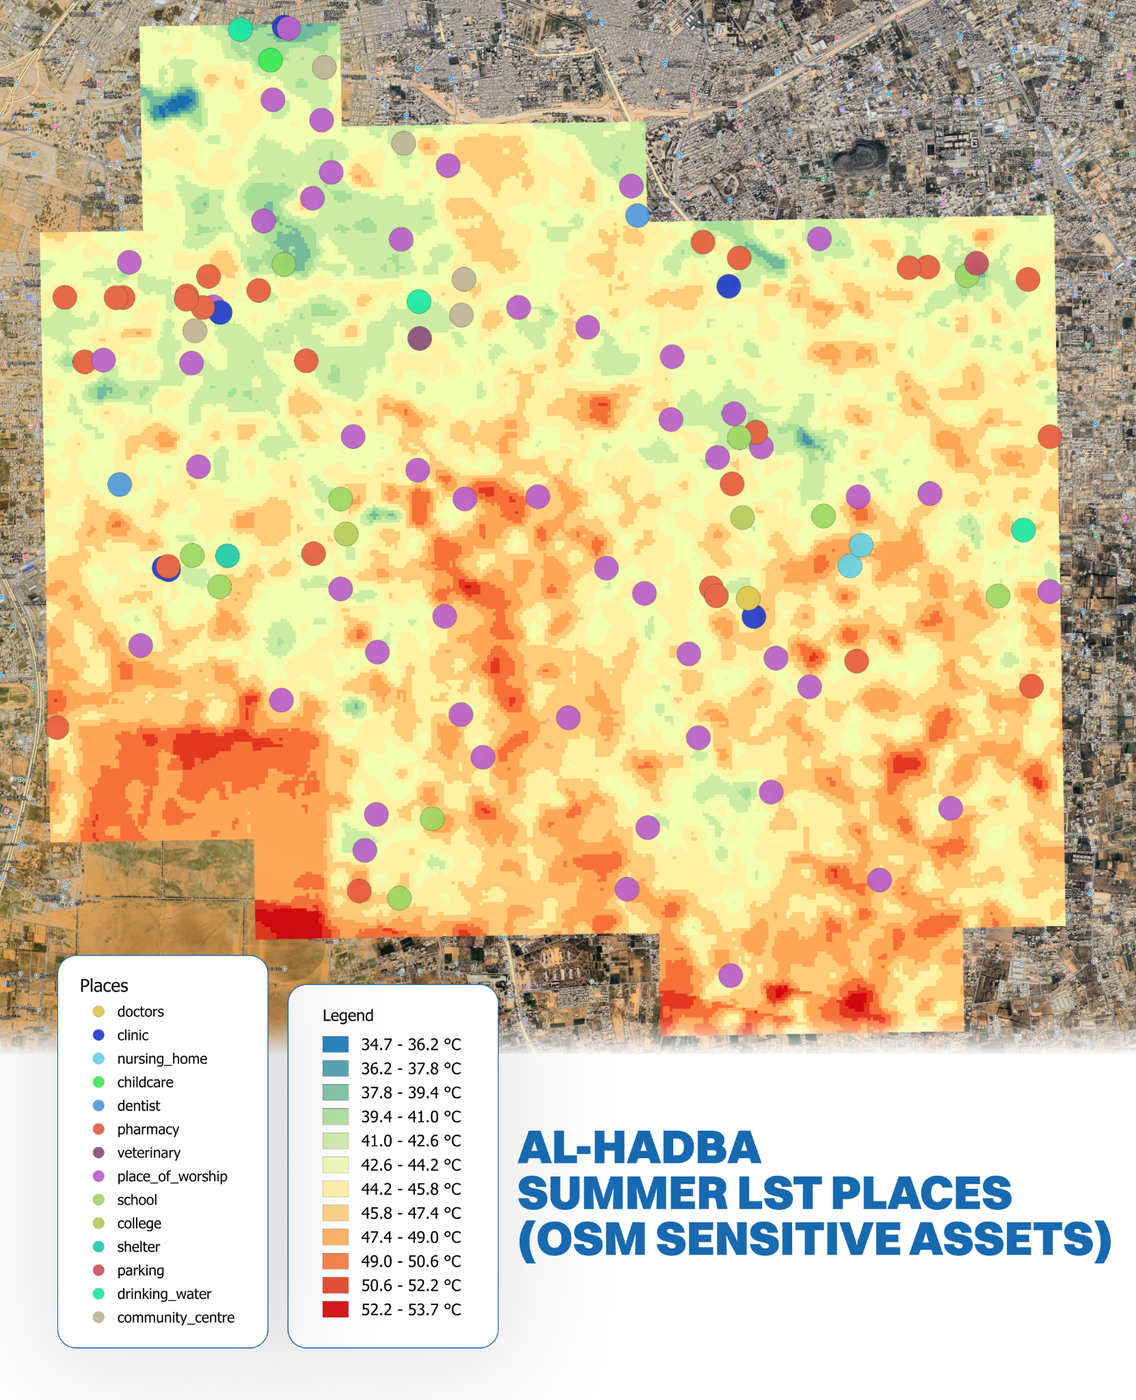
Pilot asset screening (OSM-derived, illustrative) inside the 78 km² deep-dive zone identified approximately 401 indicative points-of-interest. The categories with the highest sensitivity to sustained heat exposure include ~14 education facilities (10 schools, 2 colleges, 2 libraries), ~51 mosques, ~7 clinics and healthcare facilities, ~26 pharmacies, ~5 community centres, ~4 police and emergency stations, ~98 food markets and shops, ~57 automotive workplaces plus ~16 industrial facilities, and ~32 hospitality venues. The heat does not fall on empty land. Every school pick-up in July, every Dhuhr prayer that lands in the summer danger window, every clinic queue in August happens inside this zone.
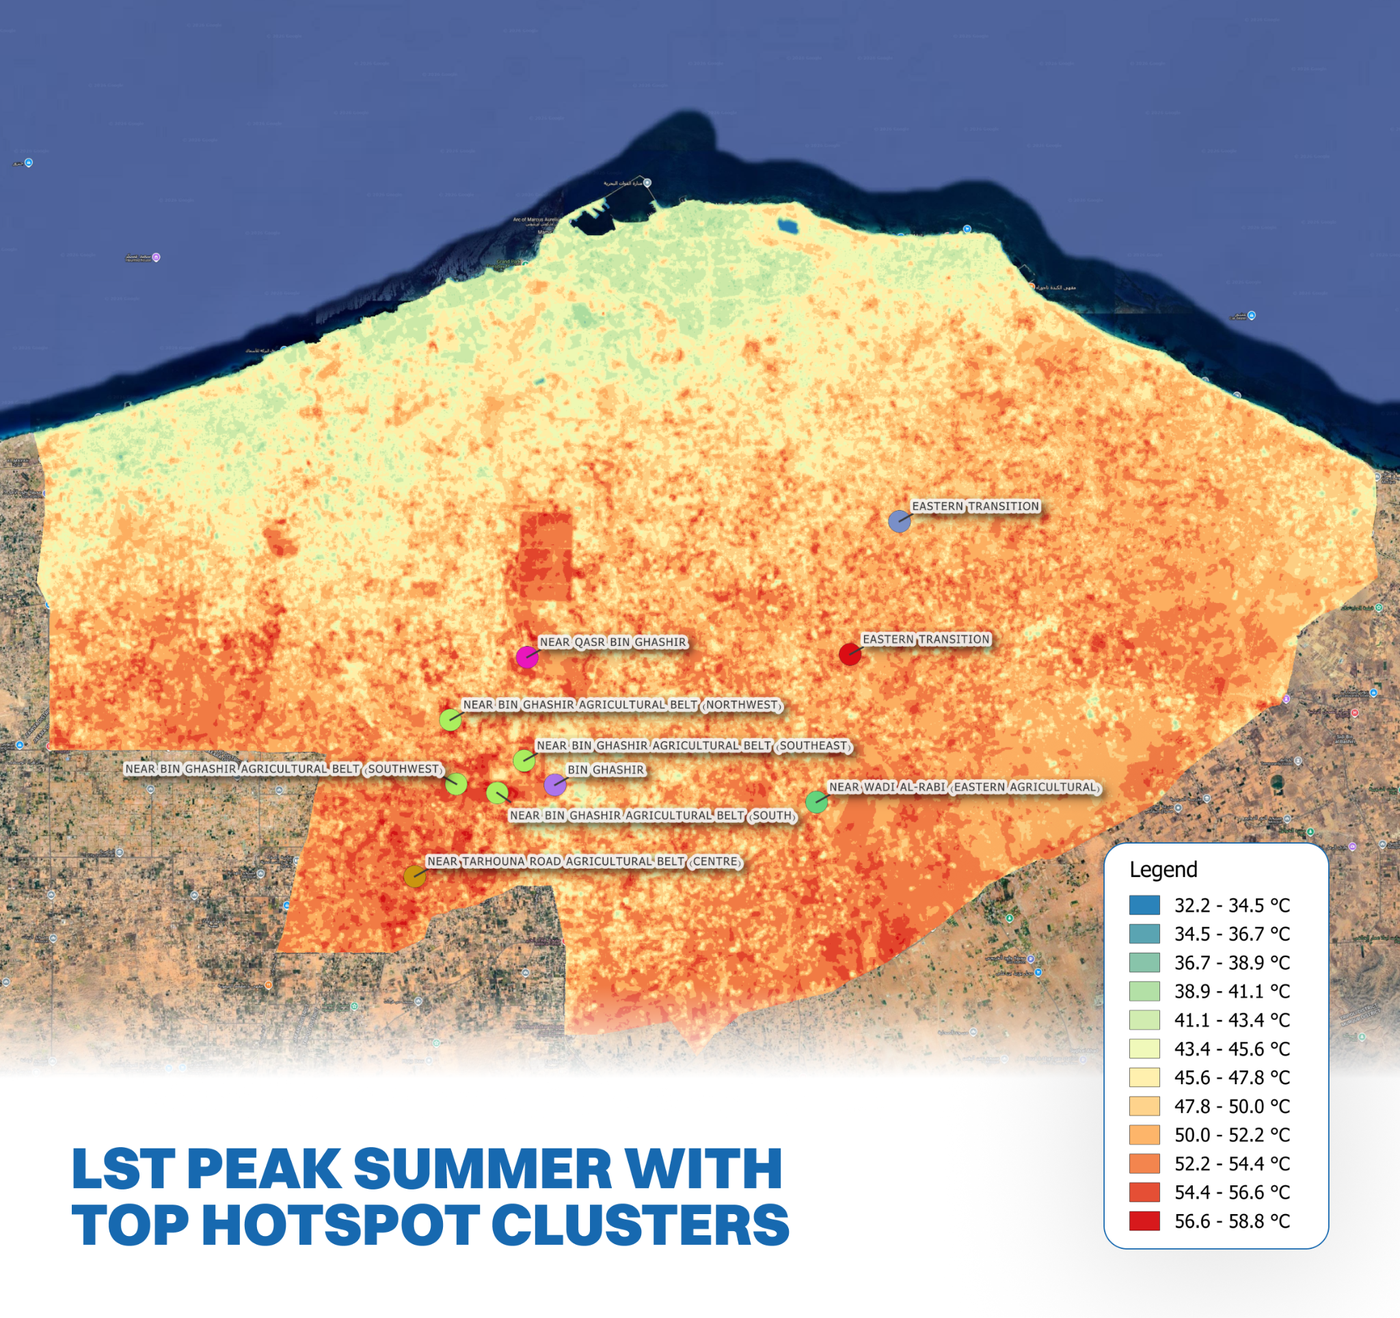
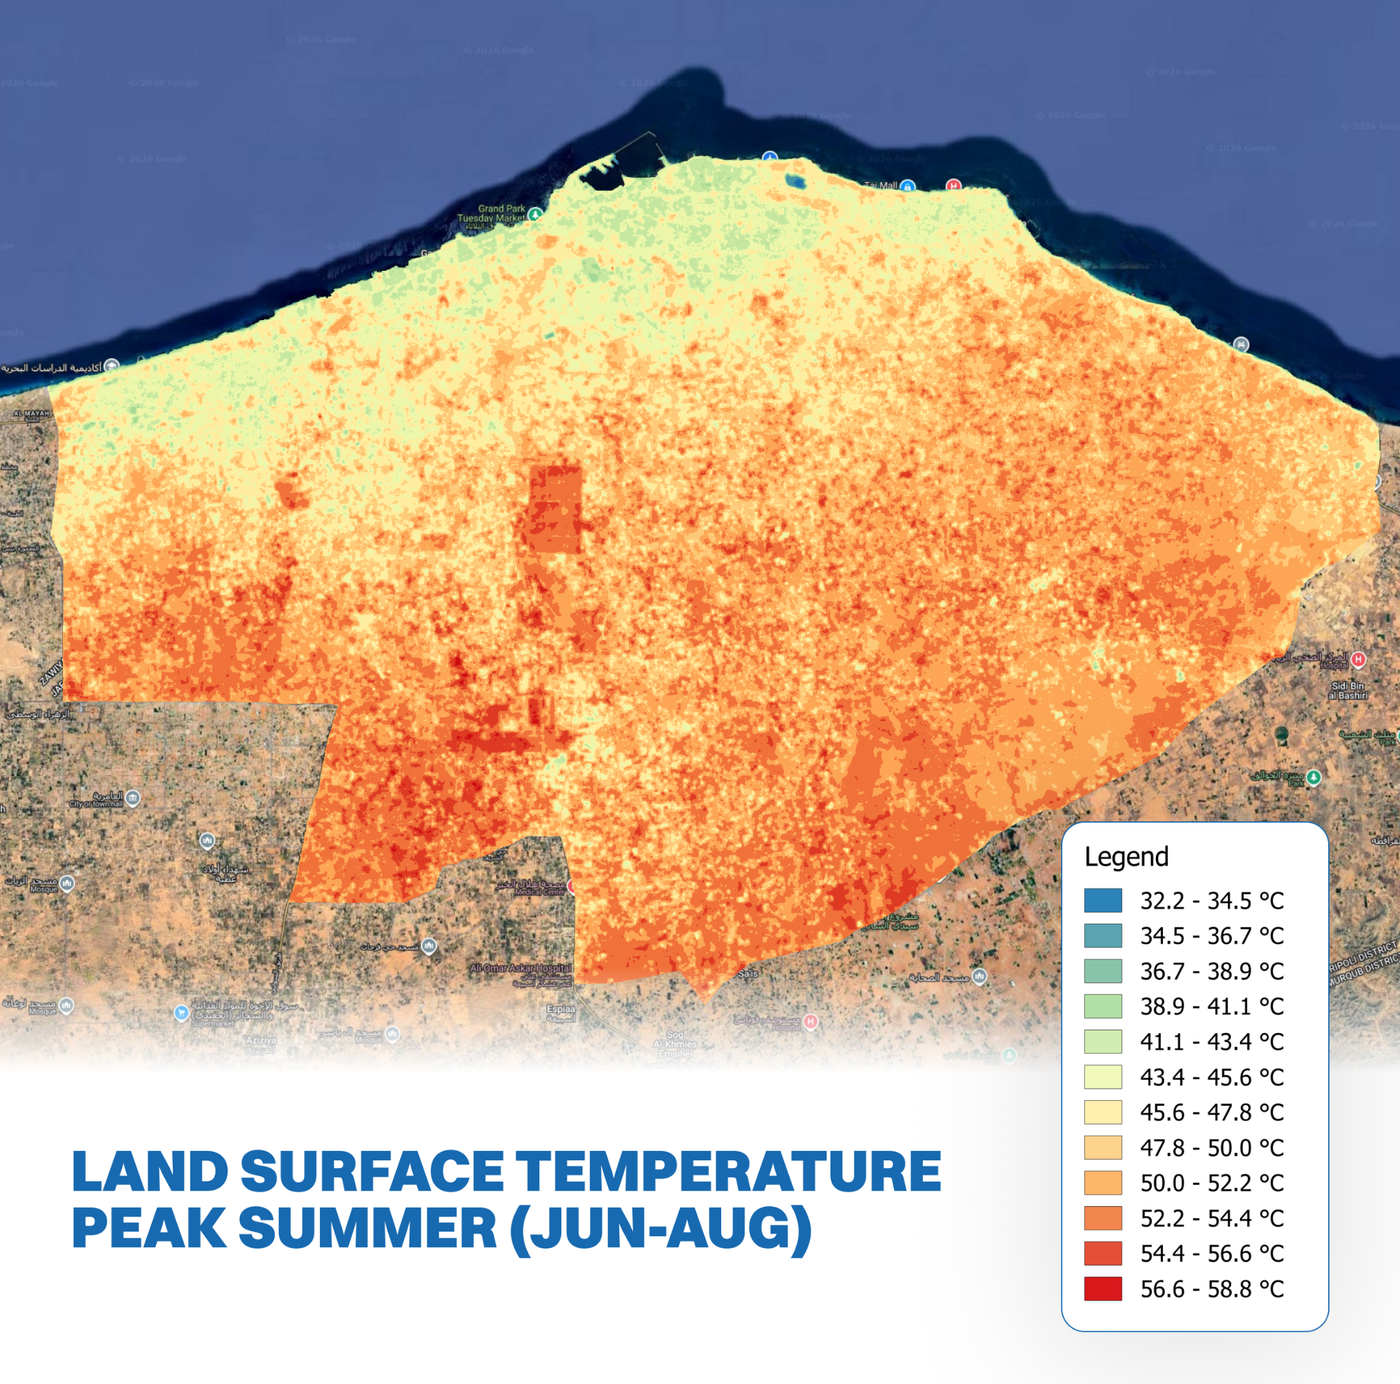
Applying a 55°C threshold (the 99th-percentile Landsat LST) and connected-component clustering across ~1.81 million valid 30 m pixels citywide, the analysis identified 105 contiguous hotspot patches, consolidated to 57 distinct hotspot zones after merging adjacent clusters within 1.5 km. Ranked by mean LST, the top 10 hotspots do not sit inside Al-Hadba.
Six of the top 10 fall in the broader Bin Ghashir agricultural belt, 9–11 km south of the city core. Three fall in the eastern agricultural transition — two in Wadi Al-Rabi and one on the Ain Zara periphery. One falls on the Tarhouna road corridor further south. None fall in the dense urban core. The largest single contiguous hot patch — over 1.3 km² of surface at or above 55°C — is in the Bin Ghashir agricultural belt.
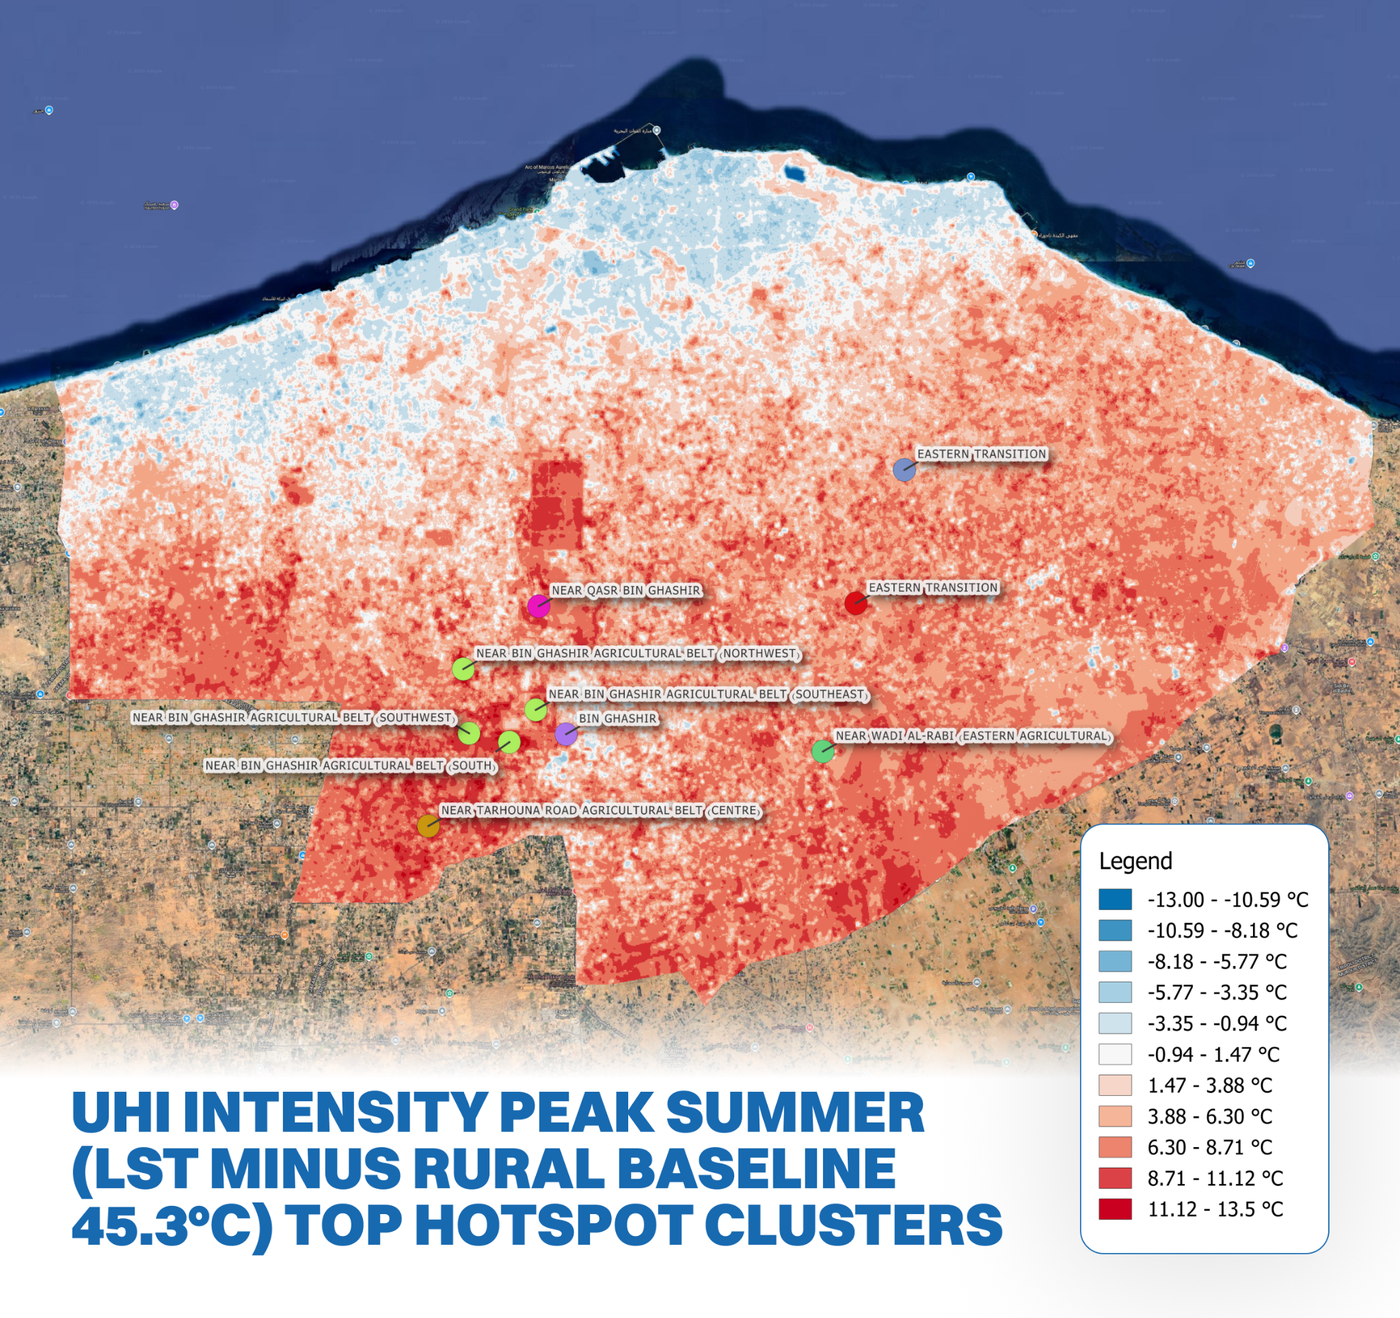
Peak LST: 58.8°C (a single Landsat pixel in the Bin Ghashir belt). Mean LST across the citywide composite is 49.7°C, with the southern-inland zone systematically running 5–10°C above coastal areas at the surface (P95 Urban Heat Island intensity: +8.5°C).
The most consequential finding of the assessment emerged from cross-tabulating the hottest pixels against ESA WorldCover 2021 land classification. Standard urban-heat framing assumes the built environment is the primary heat driver. In Tripoli, it is not.
In the Bin Ghashir agricultural belt — the hottest zone in the city — the composition of pixels at or above 55°C LST is:
88.3% grassland (dry, unirrigated), 6.4% cropland, and just 4.3% built-up. Built-up surfaces contribute 4% of the hotspot pixels in the hottest zone in the city.

The pattern is not unique to Bin Ghashir. Across all four of the city's hottest zones — Bin Ghashir, the Tarhouna road corridor, Wadi Al-Rabi, and Al-Hadba — grassland dominates the hotspot pixels (50–88%). Dry, unshaded herbaceous ground is the single largest driver of citywide LST extremes.
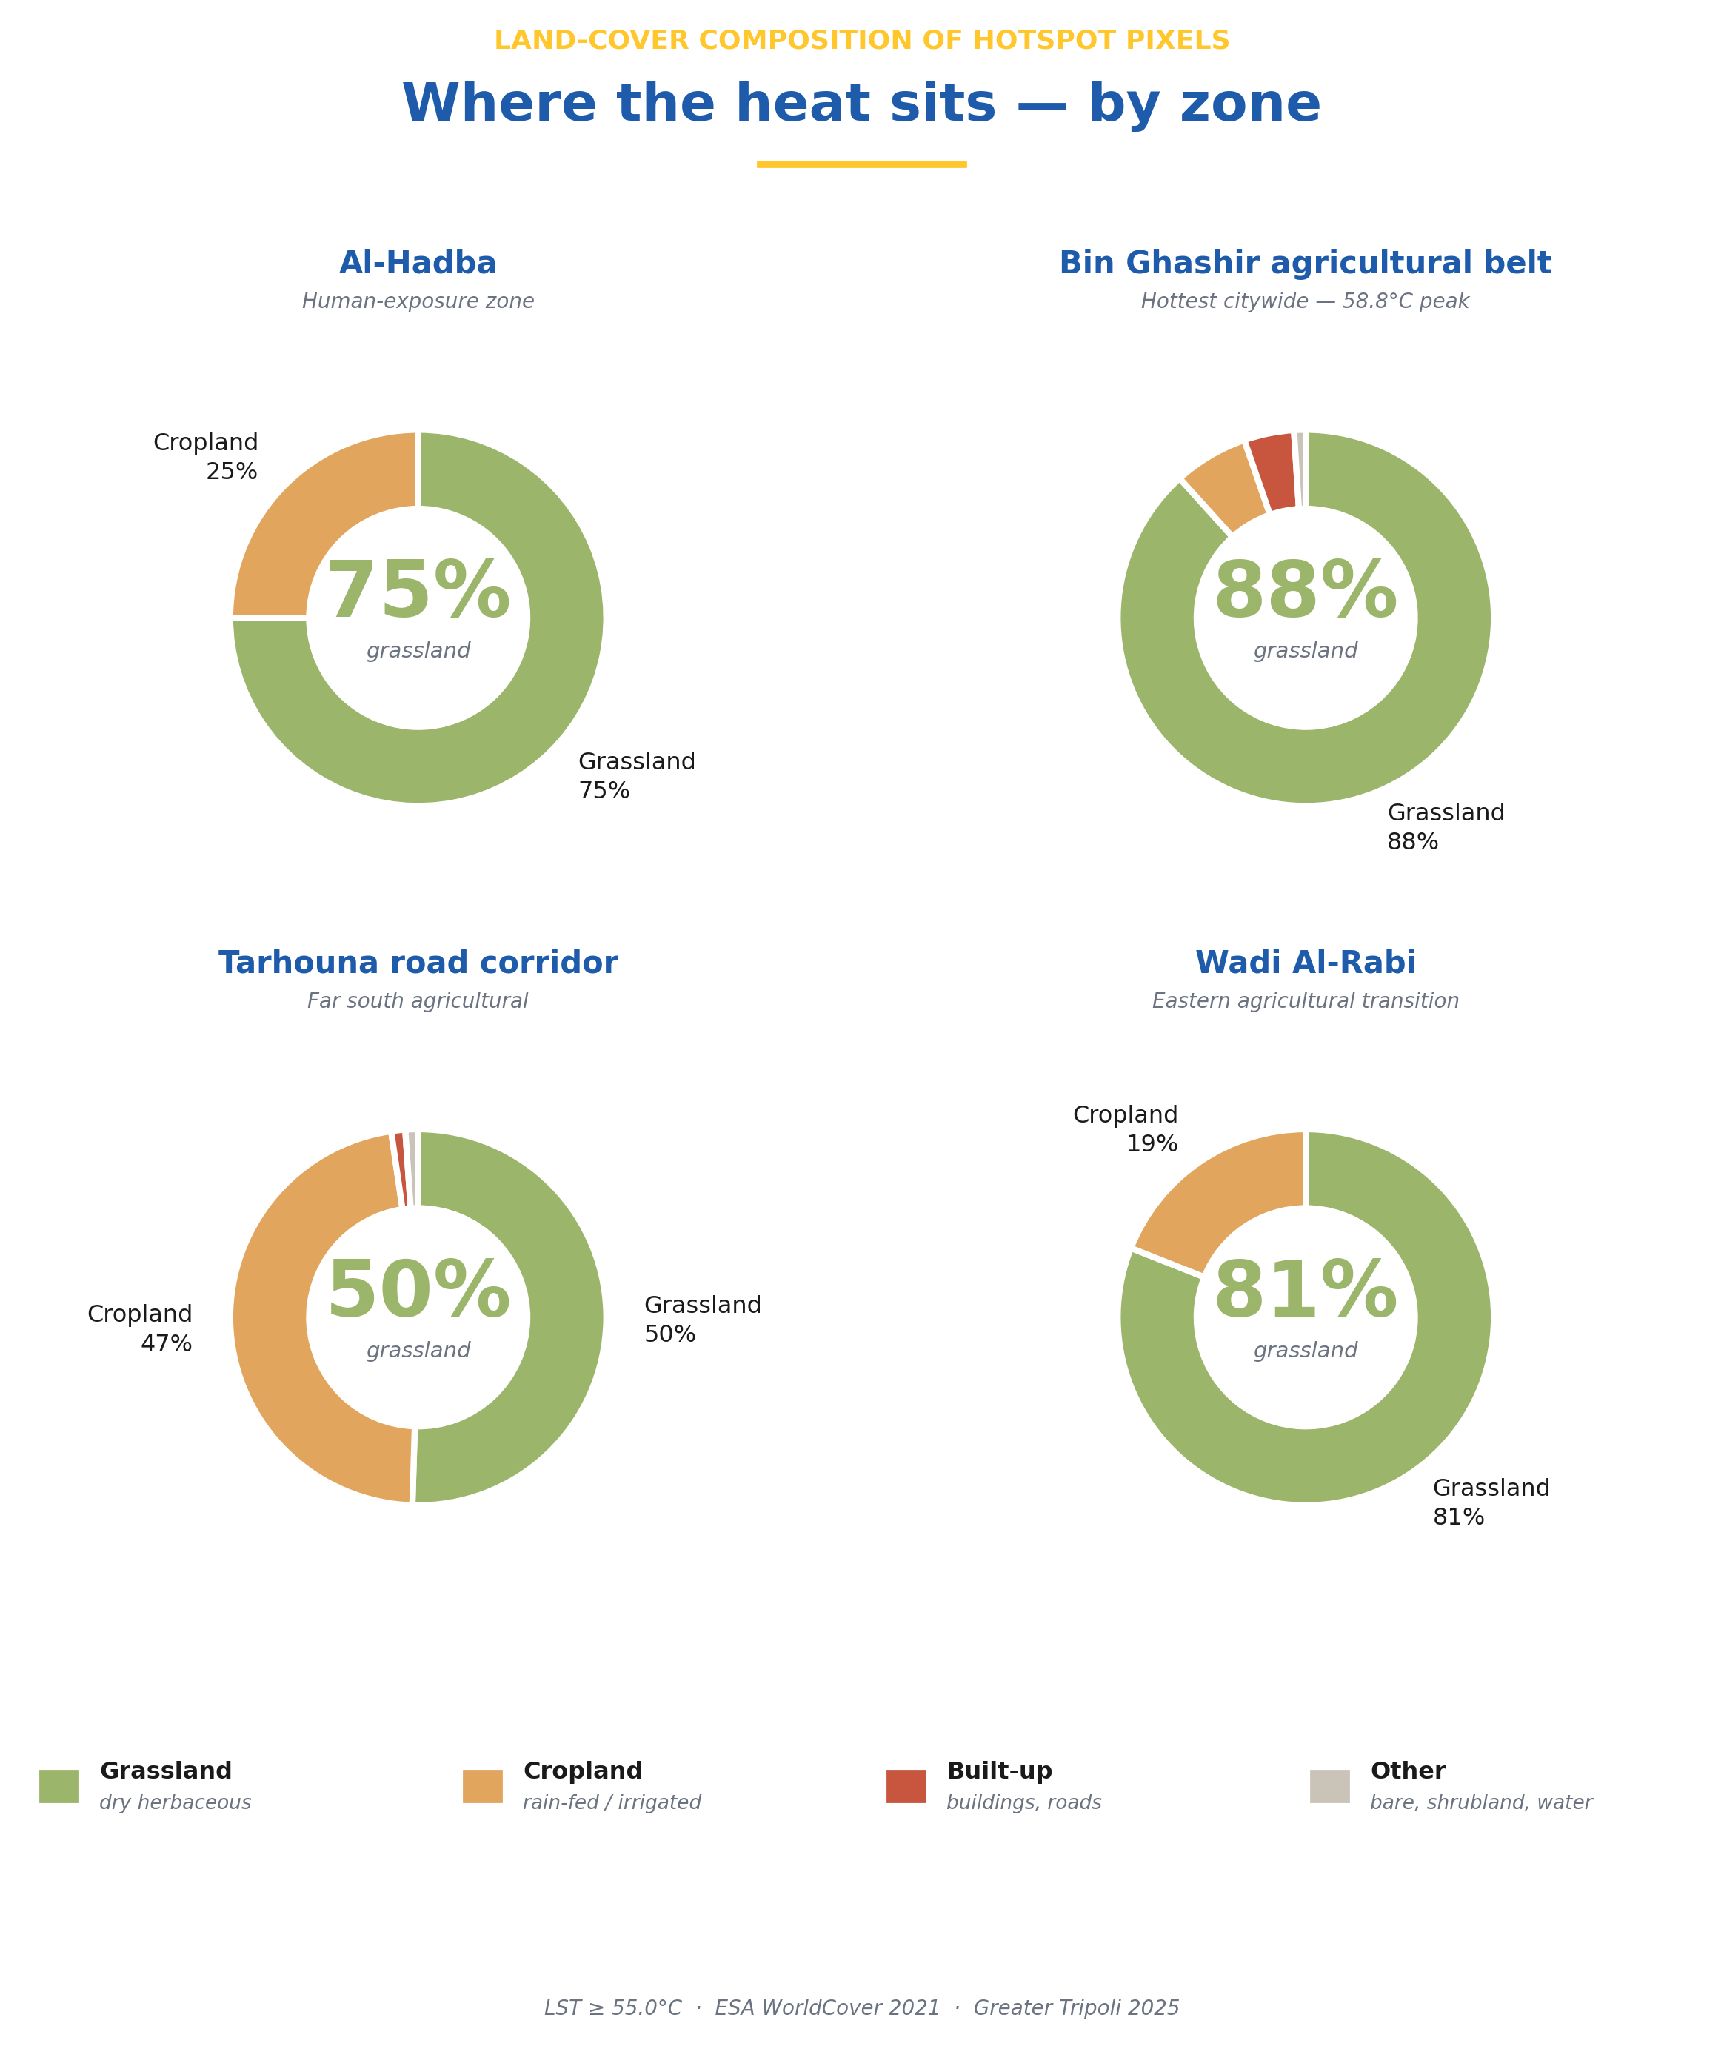
The intervention implication is direct: cool-roof and high-albedo paving programmes — the classic urban-heat playbook — would address less than 10% of the actual surface heat load in Tripoli's hottest zone. The higher-leverage moves are agricultural: irrigation scheduling, drought-tolerant tree planting along agricultural margins, soil-moisture conservation. Cool roofs will not cool a wheat field.
At the 5 km climate baseline, the Al-Hadba deep-dive zone is a single uniform block — "22.4% dangerous". Actionable at the zoning level, not at the street level. Overlaying 33 cloud-free Landsat scenes at 30 m resolution across the same zone reveals what is invisible at the climate-model scale: within that single "uniform" area, surface temperatures range from 34.7°C on vegetated and shaded patches to 53.7°C on industrial yards, military hard-standings, and unshaded paved areas.
A 19°C gradient inside a single climate-model pixel, visible patch by patch at 30 m. This is the difference between knowing a zone is a problem and knowing which specific parcels inside that zone are the problem.

The companion spectral indices (NDVI, NDBI, NDMI, albedo) explain why each patch is hot — dry vegetation, exposed bare soil, low reflectance, absence of moisture. Together they convert a strategic label into a targeted intervention map: which specific industrial parcels are absorbing the most heat, which specific farmland patches are existing cooling assets to preserve, which specific school compounds sit adjacent to high-LST patches and warrant priority shade infrastructure.
Note that 30 m surface resolution is still coarser than pedestrian-level (1–10 m) microclimate modelling. That remains a separate next-stage commission — but the 30 m analysis identifies which specific parcels warrant it.
Because the two heat problems are distinct, the intervention strategy is two-track. Neither track is a substitute for the other.
Shade provision, urban greening, high-albedo surface treatment on industrial and military hard-standings, water features, district-scale computational fluid dynamics (CFD) for airflow modelling. The zone is the highest-priority target for daytime thermal-load reduction because its combination of low wind, sustained UTCI exposure, and dense sensitive-asset concentration produces the largest population-weighted heat-stress burden in Tripoli. Any future development that increases built density or reduces open-space provision here is likely to intensify an already-strained thermal condition.
Agricultural-margin greening, irrigation scheduling, drought-tolerant tree planting, soil-moisture conservation. The Bin Ghashir belt, Tarhouna road corridor, and Wadi Al-Rabi transitions do not host dense human populations — the surface extremes there matter for regional heat contribution and for the productivity of adjacent agricultural land, not for population heat-exposure. The intervention philosophy is fundamentally different from Track A.
Both tracks are needed. Cool roofs will not cool a wheat field. And shade trees in the agricultural belt will not help the school children in Al-Hadba. Treating the two as a single problem misroutes intervention budget.
The Tripoli assessment produces four operational outputs the masterplan team can act on directly.
A physiological baseline — full-year hourly UTCI at 1,623 grid points, showing where and when humans are exposed to dangerous heat stress, with correlation to wind sheltering and other atmospheric drivers.
A surface heat-load map — 30 m Landsat LST for the entire city with 57 distinct hotspot clusters identified (top 10 ranked), cross-tabulated with land-cover class so that the why behind each hot patch is explicit.
A high-resolution intervention target — the 78 km² Al-Hadba deep-dive resolves surface temperatures at 30 m across the highest-priority human-exposure zone, converting a strategic label into a patch-level intervention priority list.
A pilot asset exposure screen — approximately 401 indicative points-of-interest inside Al-Hadba mapped against their actual surface-temperature exposure, illustrating the type of asset-level analytics a validated municipal facility register would enable.
None of the underlying data sources are Tripoli-specific. ECMWF ERA5 covers the entire populated Earth. Landsat 8/9 coverage is global. ESA WorldCover is global. The framework the Tripoli assessment demonstrates is applicable to any city with satellite coverage — which is virtually any populated area on Earth.
Want this analysis for your city? Reach out to the FortyGuard team for location-specific heat intelligence, or to request the full Greater Tripoli report, at info@fortyguard.com
.png)
.png)


.png)
.png)

.png)