 ☰☰
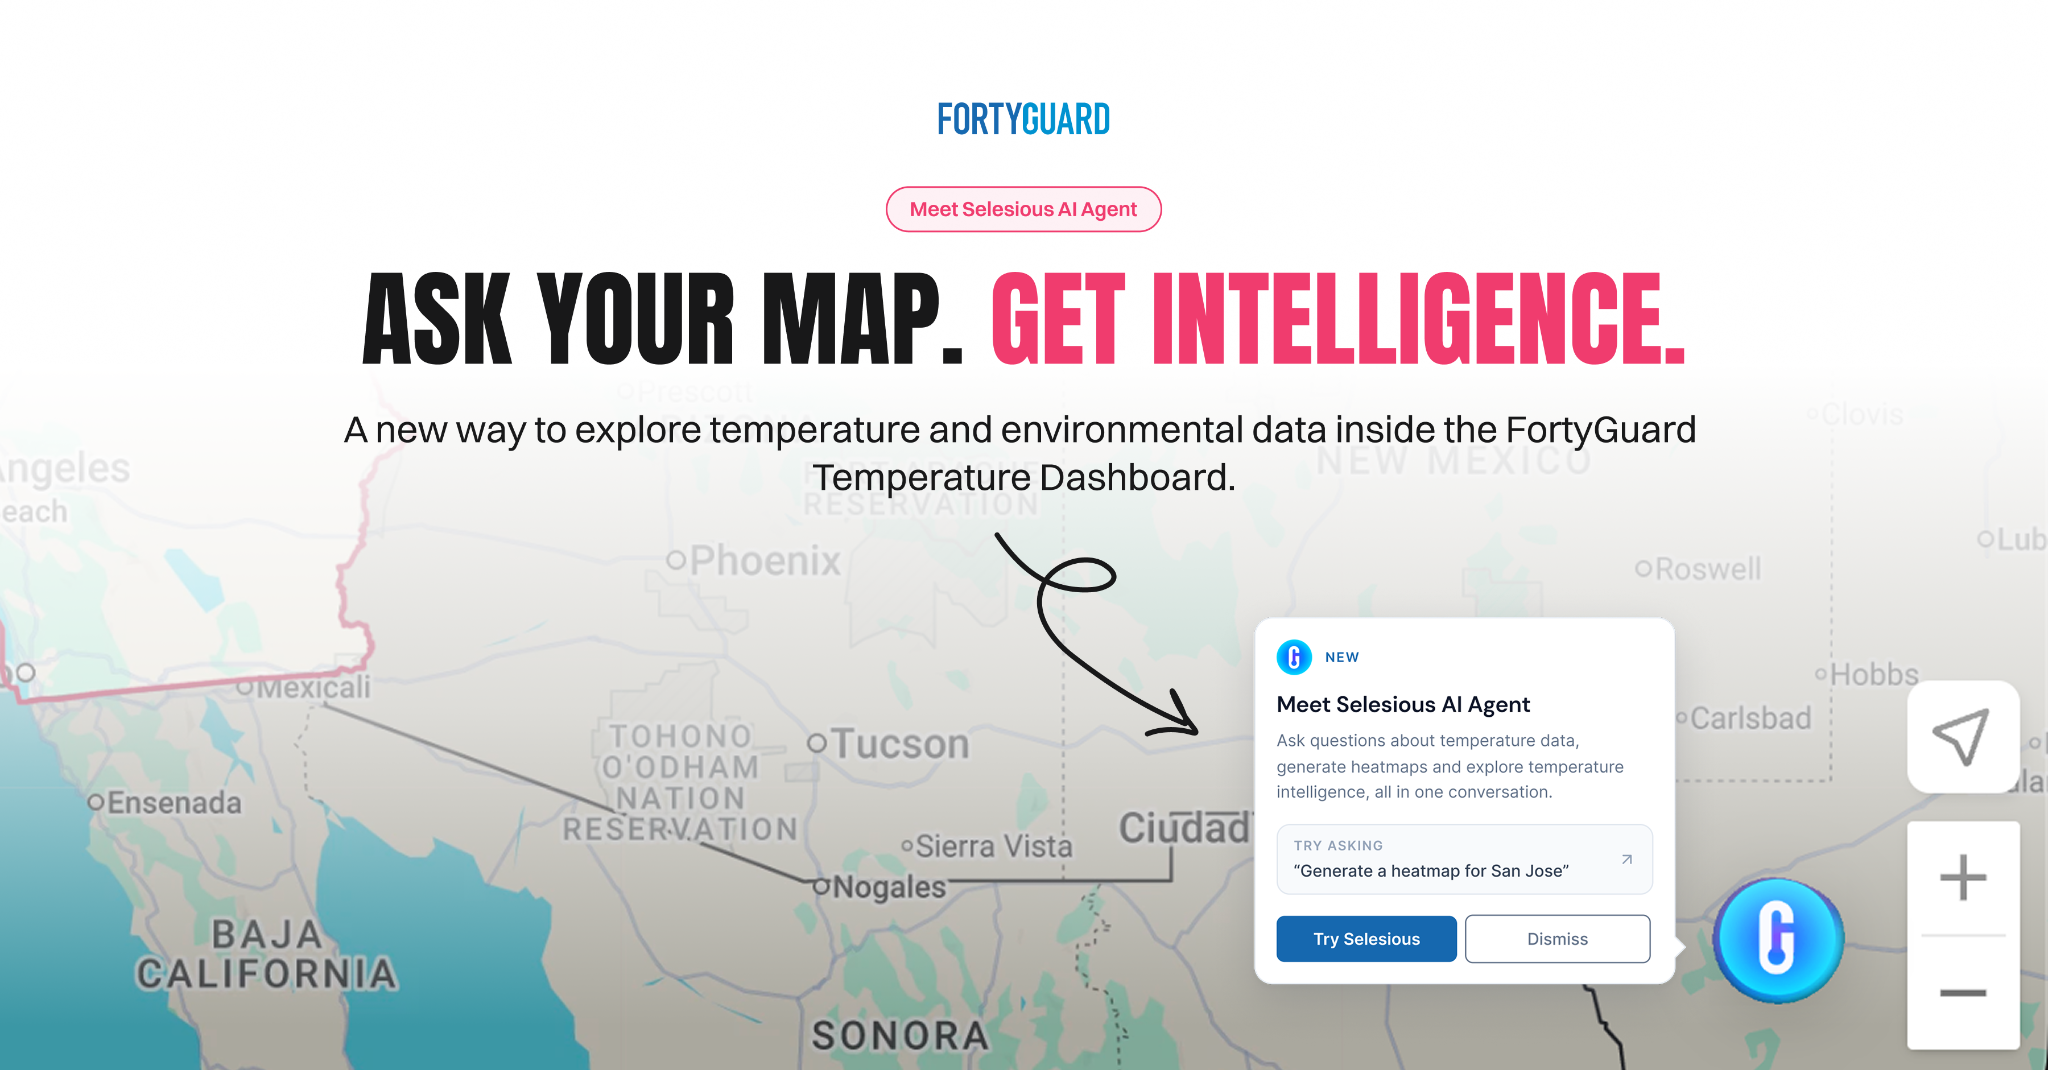
Where is the heat concentrated on this site? Does it change during the day? What should we look at before comparing one location with another? These are the questions behind a thermal assessment, and they rarely arrive in the language of a dataset.
Selesious is the agent inside FortyGuard's Temperature Dashboard, helping users turn a question into supported analysis. It brings a conversational starting point to a platform where teams can explore local temperature conditions, generate heatmaps and compare places and time periods.
A useful temperature question has a location and a purpose. A planner may be examining a public space. A developer may be comparing potential sites. An asset team may want to understand which part of a property needs a closer assessment.
Selesious gives those users a way to begin with their own question. The surrounding dashboard provides the spatial context: the area being assessed, the selected period and the temperature information available for that inquiry. The conversation and the map belong together, because the answer needs to relate to the place the team is working on.
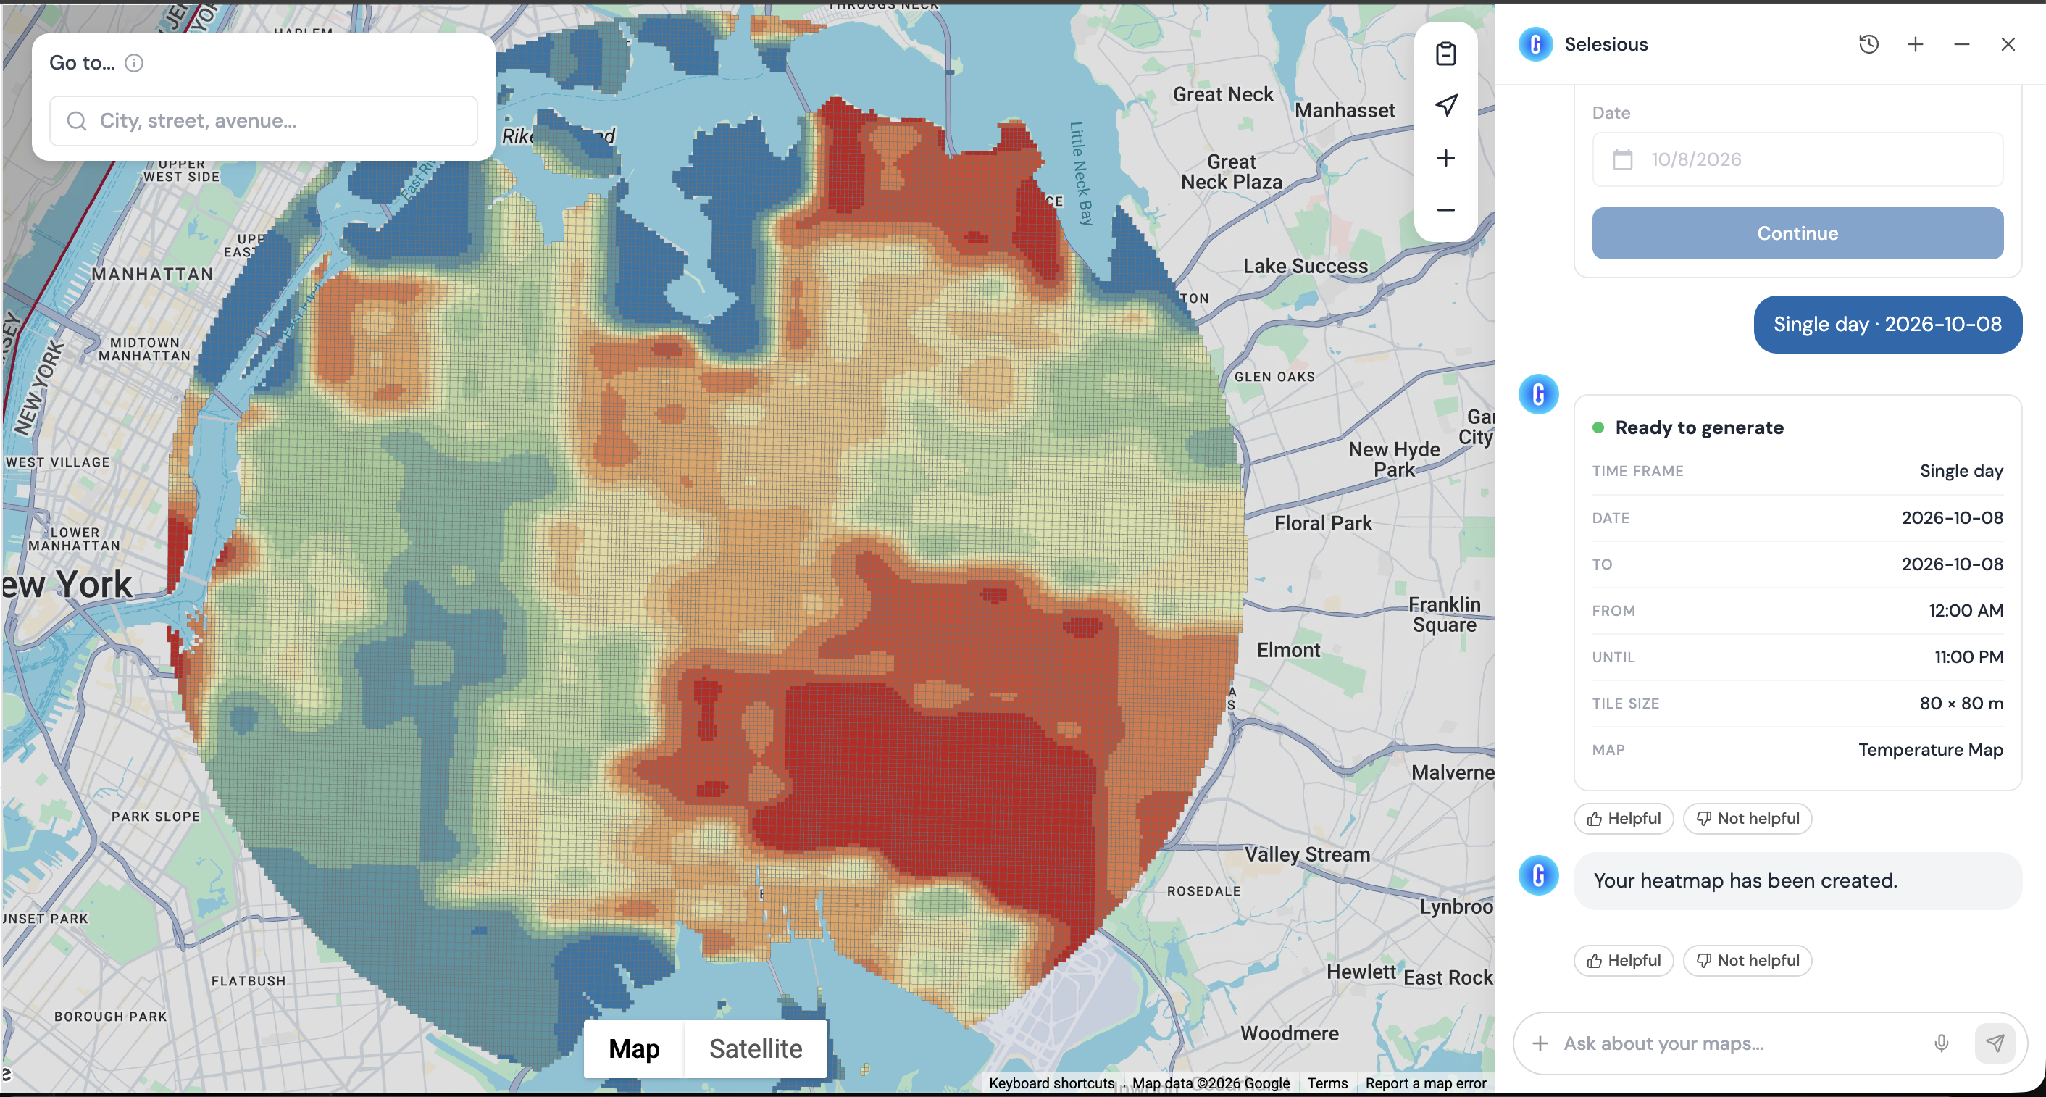
For example, a question about afternoon conditions on a development site sets a different brief from a question about how that site compares with another location. Being specific helps the analysis stay close to the project.
A helpful starting brief brings together the location, the hours of interest and the activity being considered. A public space intended for afternoon use raises different questions from a property being assessed across a longer period. Setting out that context gives the team a common reference for the discussion and makes it easier to judge whether the available analysis addresses its needs.
A heatmap can show where temperatures differ across an area. The next step is understanding what that difference means for the question being asked. Is the pattern concentrated in one part of the site? Does the selected period capture the hours that matter to the project? What additional context would help explain it?
That is where the analytical conversation becomes useful. It helps a team move from viewing a map to deciding which finding deserves attention. A first result can narrow the next inquiry, making a broad concern about heat more specific.
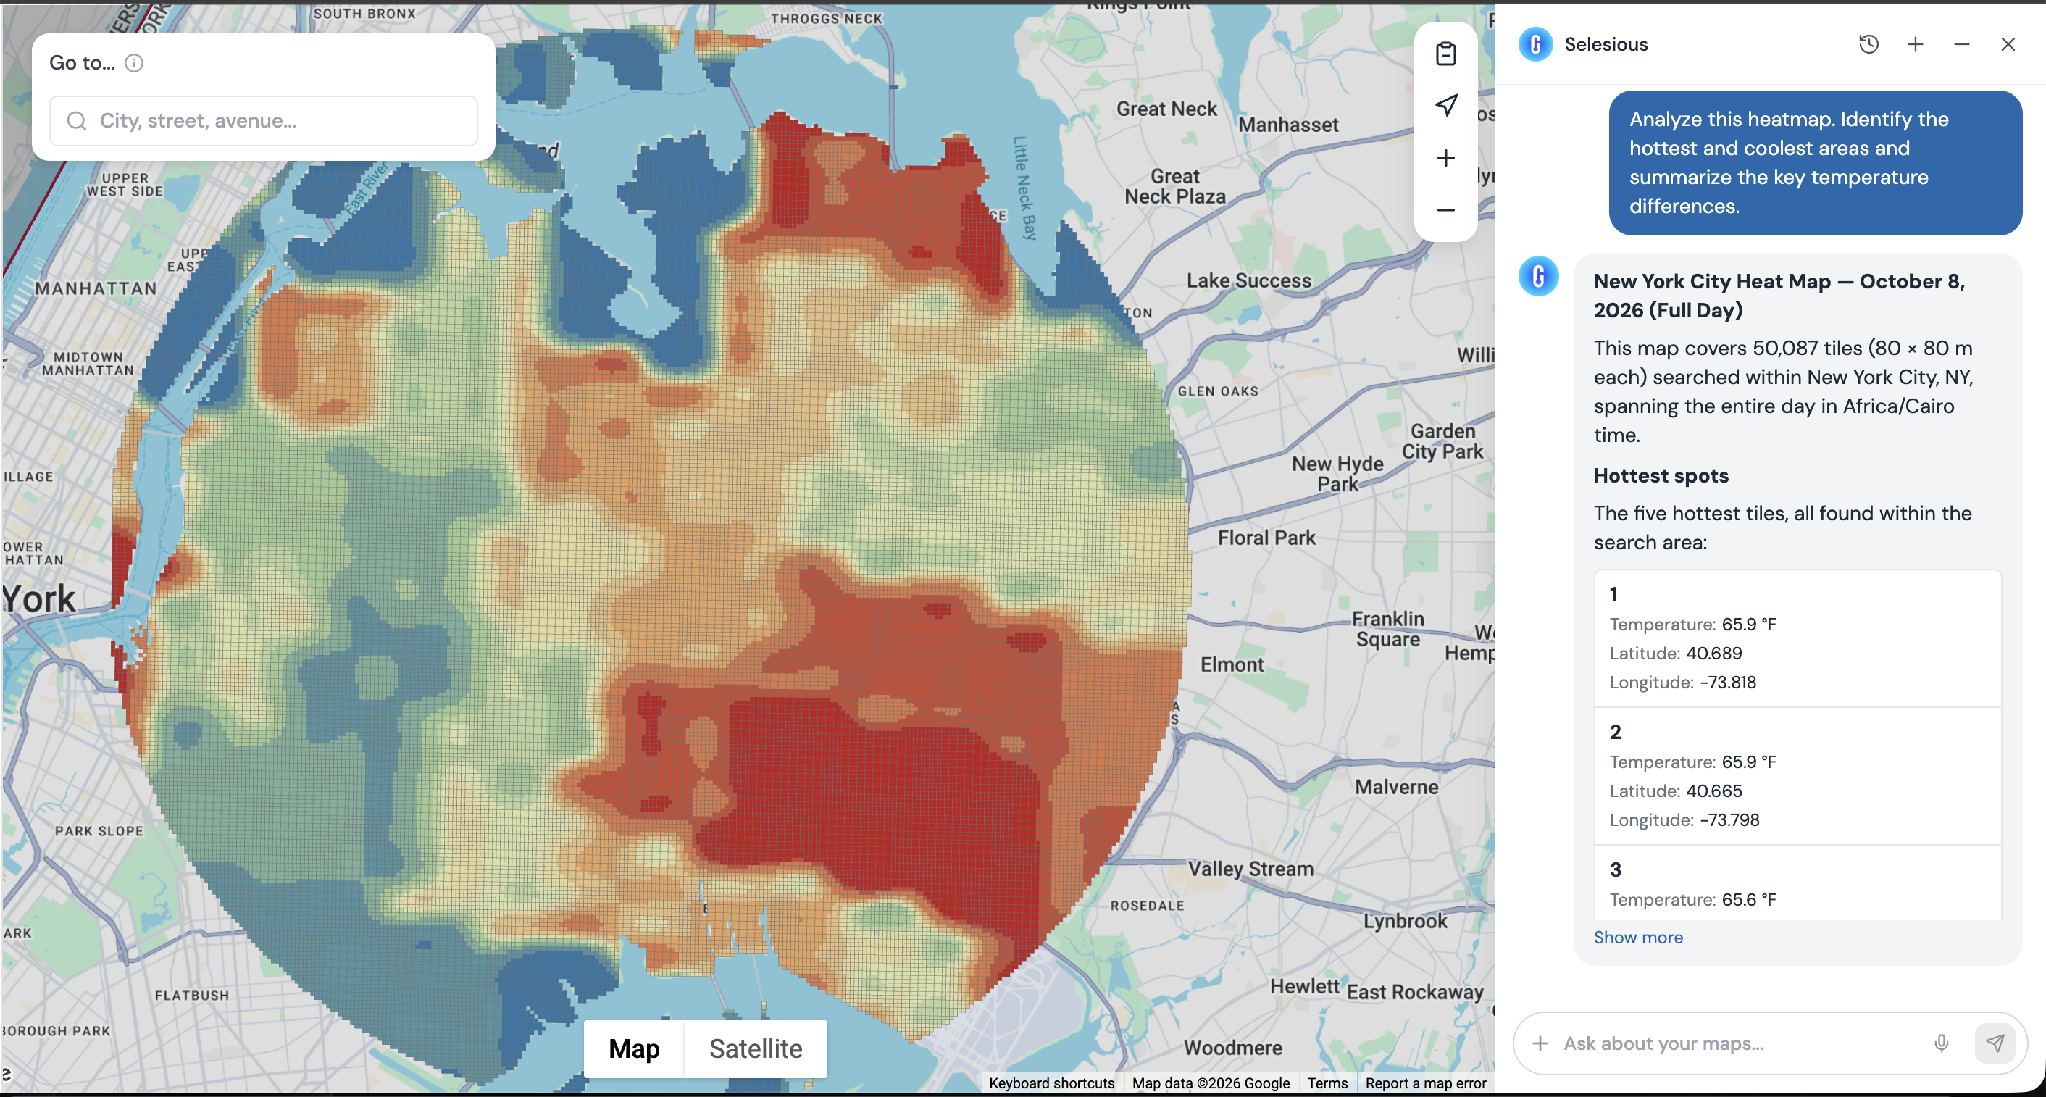
Temperature has several meanings in the physical world. A hot surface and the air above it describe different conditions. An area-wide pattern and a point-level reading also answer different questions. Understanding the variable, location and time period makes an analysis easier to interpret and share.
For a project team, this clarity matters when findings move into a design review or site discussion. The people reading the result should understand what was examined and how it relates to the work in front of them.
Imagine a team reviewing a site before a design meeting. An initial map draws attention to a particular area. That observation can help the team focus its discussion: which part of the site is involved, which hours were examined, and what further information would help explain the pattern?
The next step might be a more detailed assessment or a conversation with the people responsible for the design. Starting with a clearly framed question helps those colleagues understand why the finding matters. The value is in connecting the thermal information with the place and purpose of the project, so that the conversation can move forward on a shared basis.
At FortyGuard, we want local temperature information to be useful to the people designing, assessing and operating the physical world. Selesious helps make the starting point more approachable: a question from the work they already do.
Explore Selesious inside the Temperature Dashboard at dashboard.fortyguard.com. Bring a location and a question from your next project, and start a more informed conversation about heat.


